

Study · Slides, words and order
Pitch deck structure: what 176 decks show.
We coded 176 company pitch decks sent to spectup, slide by slide, and read 60 of them in full.
 Edwin Mik·
 Niclas Schlopsna·
The typical deck has 16 slides and 74 words a slide
Length comes first: the median of the 176 decks runs 16 slides, and the middle half run 14 to 21. The most common length is 15 slides, in 30 decks. The shortest deck is one slide and the longest has 60. What to aim for is in the guide on how long a pitch deck should be.
- 74median words a slide, middle half 50 to 103
- 27%of decks run over 100 words a slide
- 55median words a slide in decks of 25 slides or more
01Number of decks by slide count
- 9 or fewer slides9 decks
- 10 to 11 slides15 decks
- 12 to 13 slides14 decks
- 14 to 15 slides45 decks
- 16 to 17 slides24 decks
- 18 to 19 slides19 decks
- 20 to 21 slides11 decks
- 22 to 23 slides12 decks
- 24 to 25 slides11 decks
- 26 or more slides16 decks
16 decks have 10 slides or fewer, 23 have 25 or more and 6 have 30 or more.
| Measure | Value |
|---|---|
| Slides in the median deck | 16 |
| Middle half of decks, slides | 14 to 21 |
| Most common length | 15 slides, in 30 decks |
| Shortest deck | 1 slide |
| Longest deck | 60 slides |
| 9 or fewer slides | 9 decks |
| 10 to 11 slides | 15 decks |
| 12 to 13 slides | 14 decks |
| 14 to 15 slides | 45 decks |
| 16 to 17 slides | 24 decks |
| 18 to 19 slides | 19 decks |
| 20 to 21 slides | 11 decks |
| 22 to 23 slides | 12 decks |
| 24 to 25 slides | 11 decks |
| 26 or more slides | 16 decks |
| Decks with 10 slides or fewer | 16 |
| Decks with 25 slides or more | 23 |
| Decks with 30 slides or more | 6 |
| Median words a slide | 74 (middle half 50 to 103) |
| Decks over 100 words a slide | 27% |
| Median words a slide, decks of 25 slides or more | 55 |
| Words in a median deck | about 1,200 |
| Decks at 150 words a slide or more | 12 |
| Decks at 30 words a slide or fewer | 14 |
Pitch deck structure: problem first, team late, ask near the end
Measured as a share of the way through the deck, the median problem slide sits at 17%, the solution at 25%, the product at 33%, the market at 40%, traction at 57%, the team at 79% and the ask at 90%. The pitch deck outline guide sets out twelve slides and what each must prove.
carry a line that says what the company does
n=176| Slide | Where | Topic | Figure | What it counts | Base |
|---|---|---|---|---|---|
| Slide 1 of 16 | The first slide | Cover | 66% | carry a line that says what the company does | n=176 |
| Slide 3 of 16 | 17% of the way in | Problem | 62% | put the problem on slide 2 or 3, and 12% have no problem slide | n=176 |
| Slide 4 of 16 | 25% of the way in | Solution | 13 | decks have no solution slide at all | of 176 |
| Slide 6 of 16 | 33% of the way in | Product | slide 6 | is the median first product slide, and 13 decks show none before slide 10 | n=176 |
| Slide 7 of 16 | 40% of the way in | Market | 81% | print a market in the billions, and 33% show TAM, SAM and SOM together | n=149 |
| Slide 10 of 16 | 57% of the way in | Traction | 30% | put traction in the first half of the deck | n=176 |
| Slide 13 of 16 | 79% of the way in | Team | 29% | show the team before traction, among the decks that have both | of 115 decks |
| Slide 15 of 16 | 90% of the way in | Ask | 85% | name the amount they raise, and 77% say what it pays for | n=176 |
| Slide 16 of 16 | The last slide | Last slide | 46% | end with no email, web address, phone number or booking link | n=149 |
Where each topic sits across all 176 decks
Every deck is stretched to the same width, so the first slide is on the left and the last on the right. Each mark is one deck with that topic in that slice.
Median position: half the marks on each side
| Topic | Slice 1 | Slice 2 | Slice 3 | Slice 4 | Slice 5 | Slice 6 | Slice 7 | Slice 8 | Slice 9 | Slice 10 | Slice 11 | Slice 12 | Slice 13 | Slice 14 | Slice 15 | Slice 16 | Slice 17 | Slice 18 | Slice 19 | Slice 20 | Slice 21 | Slice 22 | Slice 23 | Slice 24 | Slice 25 | Slice 26 | Slice 27 | Slice 28 | Slice 29 | Slice 30 | Slice 31 | Slice 32 | Slice 33 | Slice 34 | Slice 35 | Slice 36 | Slice 37 | Slice 38 | Slice 39 | Slice 40 |
|---|---|---|---|---|---|---|---|---|---|---|---|---|---|---|---|---|---|---|---|---|---|---|---|---|---|---|---|---|---|---|---|---|---|---|---|---|---|---|---|---|
| Problem | 0% of decks | 1% of decks | 5% of decks | 11% of decks | 22% of decks | 16% of decks | 15% of decks | 10% of decks | 9% of decks | 9% of decks | 7% of decks | 3% of decks | 5% of decks | 2% of decks | 0% of decks | 3% of decks | 0% of decks | 1% of decks | 0% of decks | 0% of decks | 1% of decks | 0% of decks | 0% of decks | 0% of decks | 1% of decks | 1% of decks | 1% of decks | 0% of decks | 1% of decks | 0% of decks | 0% of decks | 0% of decks | 0% of decks | 1% of decks | 1% of decks | 0% of decks | 0% of decks | 0% of decks | 0% of decks | 0% of decks |
| Product and solution | 0% of decks | 1% of decks | 2% of decks | 3% of decks | 6% of decks | 12% of decks | 14% of decks | 15% of decks | 20% of decks | 15% of decks | 29% of decks | 15% of decks | 33% of decks | 12% of decks | 21% of decks | 12% of decks | 10% of decks | 16% of decks | 9% of decks | 4% of decks | 12% of decks | 5% of decks | 6% of decks | 6% of decks | 4% of decks | 6% of decks | 2% of decks | 4% of decks | 4% of decks | 3% of decks | 2% of decks | 2% of decks | 2% of decks | 2% of decks | 2% of decks | 1% of decks | 2% of decks | 1% of decks | 1% of decks | 1% of decks |
| Market and competition | 0% of decks | 1% of decks | 1% of decks | 5% of decks | 5% of decks | 6% of decks | 5% of decks | 5% of decks | 4% of decks | 6% of decks | 7% of decks | 7% of decks | 11% of decks | 7% of decks | 9% of decks | 14% of decks | 11% of decks | 11% of decks | 9% of decks | 2% of decks | 22% of decks | 10% of decks | 15% of decks | 10% of decks | 6% of decks | 11% of decks | 6% of decks | 5% of decks | 7% of decks | 4% of decks | 5% of decks | 3% of decks | 3% of decks | 3% of decks | 3% of decks | 2% of decks | 2% of decks | 0% of decks | 2% of decks | 0% of decks |
| Traction and customers | 0% of decks | 0% of decks | 1% of decks | 2% of decks | 2% of decks | 1% of decks | 1% of decks | 1% of decks | 1% of decks | 2% of decks | 2% of decks | 2% of decks | 2% of decks | 3% of decks | 3% of decks | 7% of decks | 3% of decks | 6% of decks | 7% of decks | 3% of decks | 8% of decks | 7% of decks | 8% of decks | 5% of decks | 9% of decks | 4% of decks | 3% of decks | 7% of decks | 6% of decks | 5% of decks | 7% of decks | 4% of decks | 2% of decks | 2% of decks | 1% of decks | 1% of decks | 2% of decks | 2% of decks | 3% of decks | 1% of decks |
| Team | 0% of decks | 1% of decks | 2% of decks | 3% of decks | 3% of decks | 1% of decks | 3% of decks | 2% of decks | 1% of decks | 2% of decks | 1% of decks | 1% of decks | 1% of decks | 0% of decks | 2% of decks | 1% of decks | 0% of decks | 2% of decks | 1% of decks | 1% of decks | 3% of decks | 2% of decks | 1% of decks | 2% of decks | 2% of decks | 2% of decks | 2% of decks | 1% of decks | 7% of decks | 2% of decks | 9% of decks | 6% of decks | 4% of decks | 11% of decks | 10% of decks | 6% of decks | 5% of decks | 4% of decks | 2% of decks | 1% of decks |
| Ask and financials | 0% of decks | 0% of decks | 0% of decks | 1% of decks | 0% of decks | 1% of decks | 1% of decks | 1% of decks | 1% of decks | 1% of decks | 3% of decks | 3% of decks | 3% of decks | 3% of decks | 2% of decks | 5% of decks | 3% of decks | 9% of decks | 9% of decks | 2% of decks | 14% of decks | 6% of decks | 12% of decks | 6% of decks | 7% of decks | 10% of decks | 15% of decks | 10% of decks | 12% of decks | 9% of decks | 18% of decks | 13% of decks | 10% of decks | 15% of decks | 14% of decks | 15% of decks | 24% of decks | 8% of decks | 6% of decks | 2% of decks |
The market gets nearly twice the room traction gets
Intro, vision and agenda slides take the largest share of the slides, 11.3%. Of the named topics the market takes 9.0% and traction 5.1%. Customers, shown separately from traction, take 1.9%. What belongs on the pitch deck traction slide is in the guide.
| Topic | Share of the slides |
|---|---|
| Intro, vision, agenda | 11.3% |
| Market | 9.0% |
| Product | 8.6% |
| Problem | 7.3% |
| Team | 6.2% |
| Business model | 5.8% |
| Traction | 5.1% |
| Competition | 4.9% |
| Financials | 4.6% |
| Roadmap | 4.3% |
| Appendix | 2.0% |
| Customers | 1.9% |
One in five decks has no hard number in its first three slides
21% of decks print no figure on slides 1 to 3, and one prints 70. Nearly half of the decks with a readable text layer end with no contact detail.
print no hard number on slides 1 to 3
n=176| Gap | Share | Decks counted |
|---|---|---|
| print no hard number on slides 1 to 3 | 21% | n=176 |
| end with no email, web address, phone or booking link | 46% | n=149 |
| give no traction figures | 40% | n=176 |
| name no CEO anywhere in the deck | 38% | n=149 |
| Show no forward financials | 30% | n=176 |
| Show no team photos | 27% | n=176 |
| Have no problem slide | 12% | n=176 |
| Name no ask at all | 11% | n=176 |
Traction figures show in 93% of early-revenue decks and 33% of pre-revenue decks
Read from the deck itself, 90 decks are pre-revenue and 68 are early revenue. Early-revenue decks show more of everything that needs a customer, and the same share carry a competition slide. How the deck changes as the company grows is in the guide on how a pitch deck changes by stage.
One dot is one percent of the decks at that stage
| Measure | Pre-revenue, 90 decks | Early revenue, 68 decks |
|---|---|---|
| Traction as figures | 33% | 93% |
| Team photos | 63% | 84% |
| Forward financials | 61% | 82% |
| Cover says what the company does | 62% | 68% |
| Competition slide | 70% | 70% |
| No ask at all | 16% | 4% |
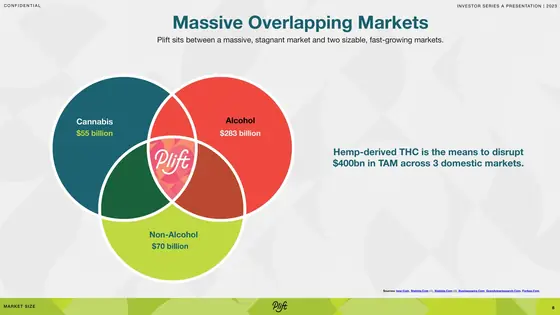
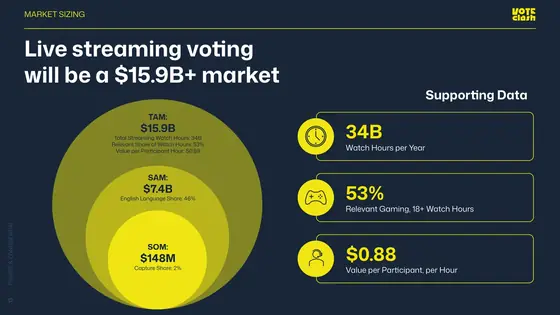
81% claim a billion-dollar market and 33% show TAM, SAM and SOM together
Of the 149 decks with a text layer, 89% print a money figure on the market slide and 81% print one in the billions. The median largest figure in a deck is $86bn, and the middle half run from $16bn to $403bn. TAM is the total market, SAM the part a company can serve and SOM the part it expects to win.
A TAM
A SAM
A SOM
TAM, SAM and SOM together
- A source named for any market figure44%
- "Capture 1%, 2% or 5% of the market" line20%
- Says bottom-up or top-down6%
Share of the 149 decks with a readable text layer. Nearly half of the decks with a market figure in the billions, 57 of 120, name no source for it.
The scale is logarithmic: each tick is ten times the one before. 17 decks state $1 trillion or more at their largest. In the 60 decks read in full, 54 state a market size and 24 name where it comes from. 20 of the 120 decks with a figure in the billions stay under $10bn at their largest.
| What | Figure |
|---|---|
| Print a money figure on the market slide | 89% |
| Print one in the billions | 81% |
| A TAM | 48% |
| A SAM | 39% |
| A SOM | 36% |
| TAM, SAM and SOM together | 33% |
| A source named for any market figure | 44% |
| "Capture 1%, 2% or 5% of the market" line | 20% |
| Says bottom-up or top-down | 6% |
| Median largest market figure in a deck | $86bn |
| Middle half of the largest market figures | $16bn to $403bn |
| Decks at $1tn or more | 17 |
| Decks with a market figure in the billions that name no source | 57 of 120 |
| Decks with a figure in the billions under $10bn at their largest | 20 of 120 |
| In the 60 decks read in full: state a market size | 54 |
| In the 60 decks read in full: name where it comes from | 24 |
Platform appears in 77% of decks, global in 80% and AI in 62%
We counted words across the 149 decks with a text layer. Each word is set at a size that follows the share of decks that use it.
AI62%
- 51%make a claim like "world's first", "the largest" or "the only"
- 15%say "first of its kind"
- 68%use AI in the wider sense, with machine learning, LLM or agents
- 6times a median deck that uses AI says it
Share of decks that use the word at least once. Global includes worldwide and international, scale includes scalable, transform includes reimagine and game changer, revolutionary includes disrupt, and blockchain includes web3 and crypto. Text counts are floors, because pictures of text are invisible to a text count.
| Word | Share of decks |
|---|---|
| Global | 80% |
| Scale | 78% |
| Platform | 77% |
| First | 70% |
| Only | 62% |
| AI | 62% |
| Innovation | 46% |
| Leading | 40% |
| Transform | 40% |
| Revolutionary | 37% |
| Proprietary | 34% |
| Seamless | 23% |
| Sustainable | 22% |
| Blockchain | 16% |
| Unicorn | 3% |
| Synergy | 2% |
| Make a claim like "world's first", "the largest" or "the only" | 51% |
| Say "first of its kind" | 15% |
| Use AI in the wider sense, with machine learning, LLM or agents | 68% |
| Times a median deck that uses AI says it | 6 |
Dollars appear in 90% of decks, an x multiple in 44% and a CAGR in 27%
Across the 149 decks with a text layer (CAGR is compound annual growth rate), 90% use the dollar sign, 17% the euro and 9% the pound. Six decks use the euro only. 19% mix two or more currencies. Which figures to show, and how to tie them out, is in the pitch deck financials slide guide.
- 44%print an "x" multiple
- 39%tie a percentage to growth
- 27%print a CAGR, with a median of about 14%, which is the market's growth, not the company's
- 77%write amounts with an M, 60% with a B and 53% with a K
- 74%write thousands with a comma, 10% with a space and 3% with a dot
| What | Share of decks |
|---|---|
| Use the dollar sign | 90% |
| Use the euro sign | 17% |
| Use the pound sign | 9% |
| Use the euro only | Six decks |
| Use two or more currencies in one deck | 19% |
| Print an "x" multiple | 44% |
| Tie a percentage to growth | 39% |
| Print a CAGR (median CAGR about 14%, the market's growth, not the company's) | 27% |
| Write amounts with an M | 77% |
| Write amounts with a B | 60% |
| Write amounts with a K | 53% |
| Write thousands with a comma | 74% |
| Write thousands with a space | 10% |
| Write thousands with a dot | 3% |
82% of slide titles are used by no other deck
The 149 decks hold 2,039 distinct titles. The most common is a thank-you slide, ahead of the business model and the problem.
Most common titles
Decks that use the title, of 149.
How decks write
- 4words in the median title; 18% of titles run eight or longer
- 23words in the average sentence, long for a slide
- 3decks title all eight classic sections
- 26%title six or more of them
| What | Figure |
|---|---|
| Slide titles used by no other deck | 82% |
| Distinct titles in the 149 decks | 2,039 |
| Decks titled "Thank you" | 34 |
| Decks titled "Business model" | 23 |
| Decks titled "The problem" | 15 |
| Decks titled "Team" | 14 |
| Decks titled "Go to market" | 12 |
| Decks titled "Market opportunity" | 12 |
| Decks titled "Competitive landscape" | 11 |
| Decks titled "Why now" | 11 |
| Decks titled "Traction" | 11 |
| Use at least one all-caps title | 56% |
| Have at least one slide that opens with a question | 31% |
| Use exclamation marks | 31% |
| Use a real emoji | 6% |
| Words in the median title | 4 |
| Titles that run eight words or longer | 18% |
| Words in the average sentence | 23 |
| Decks that title all eight classic sections | 3 |
| Decks that title six or more of them | 26% |
62% name their CEO in the deck
88% of the 176 decks have a team slide and 73% show photos on it. Of the decks with a text layer, 62% name a CEO and 69% describe the team in years of experience. Of the 97 with a slide whose title contains the word team, 32 name no CEO.
01Four more counts from the decks
33% of 176 show traction as figures and name customers
4 of 149 decks name a big-name past employer
6 of 10 competition slides read by hand name rival companies
21 of 60 of the 60 read in full show a logo wall
| What the deck shows | Share |
|---|---|
| Team slide | 88% |
| Photos on the team slide | 73% |
| Years-of-experience line | 69% |
| A named CEO anywhere in the deck | 62% |
| A degree or university | 31% |
| of 176 show traction as figures and name customers | 33% |
| of 149 decks name a big-name past employer | 4 |
| competition slides read by hand name rival companies | 6 of 10 |
| of the 60 read in full show a logo wall | 21 of 60 |
46% of decks end without a contact detail
Of the 149 decks with a text layer, 48% put an email on the last slide, 47% a web address and 19% a phone number. 5% give LinkedIn and 1% a booking link. How the deck reaches the investor is in the guide on how to send a pitch deck to investors.

The median deck has no hyperlink at all.
Share of the 149 decks whose last slide shows it.
- Email48%
- Web address47%
- A thank-you or thanks line21%
- Phone number19%
- LinkedIn5%
- QR code3%
- Booking link1%
108 of 176 end on a closing slide22 end on an appendix14 end on the ask
| What the last slide shows | Share of the 149 decks |
|---|---|
| 48% | |
| Web address | 47% |
| A thank-you or thanks line | 21% |
| Phone number | 19% |
| 5% | |
| QR code | 3% |
| Booking link | 1% |
| of 176 end on a closing slide | 108 |
| end on an appendix | 22 |
| end on the ask | 14 |
The longest deck has 60 slides and the wordiest 600 words a slide
The edges of the study, one fact each.
16slides in the median deck
70numbers on the first three slides of one deck
1 / 60slides in the shortest and the longest deck
74words a slide in the median deck
600median words a slide in the wordiest deck
- 6,160words in the deck with the most text, to the nearest ten
- 58stars in one deck
- 4decks that say "unicorn"
| Edge | Figure |
|---|---|
| slides in the shortest and the longest deck | 1 / 60 |
| median words a slide in the wordiest deck | 600 |
| numbers on the first three slides of one deck | 70 |
| words in the deck with the most text, to the nearest ten | 6,160 |
| stars in one deck | 58 |
| decks that say "unicorn" | 4 |
| slides in the median deck (for comparison) | 16 |
| words a slide in the median deck (for comparison) | 74 |
How the decks were counted
The decks were sent to spectup by mail, in files and in shared folders. Only company raise decks are counted: fund decks, stand-alone teaser documents and decks that could not be opened are left out. What a pitch deck is, and who reads it, is in the guide what is a pitch deck.
- 176coded slide by slide from the images
- 149also read as text, so text counts are floors
- 60read in full for content

01How the coding was checked
One model coded most decks on one fixed sheet. A second coder re-coded 16 decks for structure and 10 for content. Structure fields mostly agreed, on 14 to 16 of 16, the level of traction on 10 of 16, and the content fields on 8 to 10 of 10.
02The limits of the study
The 60 decks read in full were picked to cover pre-revenue and early-revenue decks evenly, so their shares are not shares of the 176.
Decks sent to spectup are not the market. The study describes what they contain and says nothing about what works.
The page prints counts and medians only. No company is named, and no deck is tied to a sender.
Pitch deck structure: questions and answers
01How long is a typical pitch deck?
The median deck in the study has 16 slides and the middle half run 14 to 21. The most common length is 15 slides, in 30 of the 176 decks. The shortest is a single slide and the longest has 60.
02How many words are on a pitch deck slide?
A median deck carries 74 words a slide, with the middle half between 50 and 103. 27% of decks run over 100.
03What order do pitch decks follow?
By median position in the deck, the problem sits at 17%, the solution at 25%, the product at 33%, the market at 40%, traction at 57%, the team at 79% and the ask at 90%.
04How many pitch decks name the amount they raise?
85% of the 176 decks name an amount and 77% name the amount and what it pays for. 11% have no ask at all.
05How many pitch decks cite a source for their market size?
Of the 149 decks with a readable text layer, 81% print a market figure in the billions and 44% name a source for any market figure.
06What is on the last slide of a pitch deck?
Email appears on 48% of last slides, a web address on 47% and a phone number on 19%. 46% of the 149 decks give none of email, web address, phone number or booking link.
07Which decks are in the study, and what does it not say?
Company raise decks sent to spectup by mail, in files and in shared folders; fund decks, stand-alone teaser documents and decks that could not be opened are left out. 176 were coded from the slide images and 149 were also read as text. Decks sent to spectup are not the market, so the study describes what they contain and does not say what works.
Related research on raising capital
This study counts what decks contain. The other research looks at who takes the first meeting, how outreach performs by quarter and what LPs look for in a fund deck.
 / 013 in 4first meetings are with VCsResearchWho takes investor meetingsAbout three in four first meetings are with VCs, and nearly six in ten with US-based investors.
 / 027decks per meetingQuarterly index, 34 programmesCapital Access Index, Q4 2026How many decks it takes to book one investor meeting, and how meetings a week change as outreach runs on.
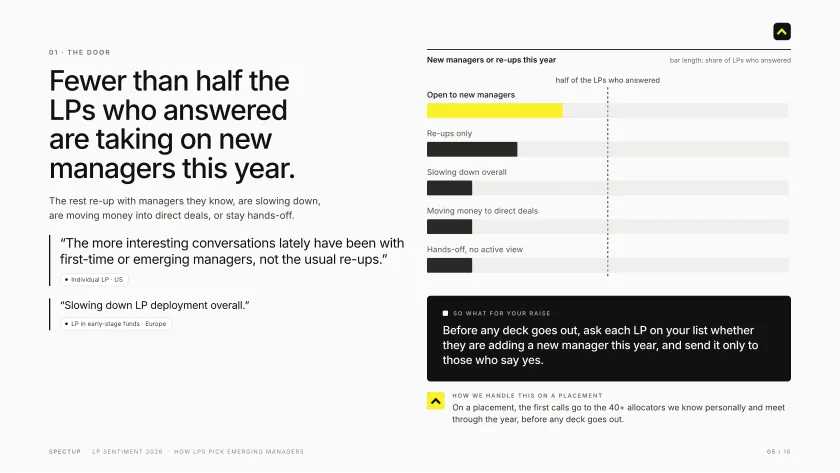
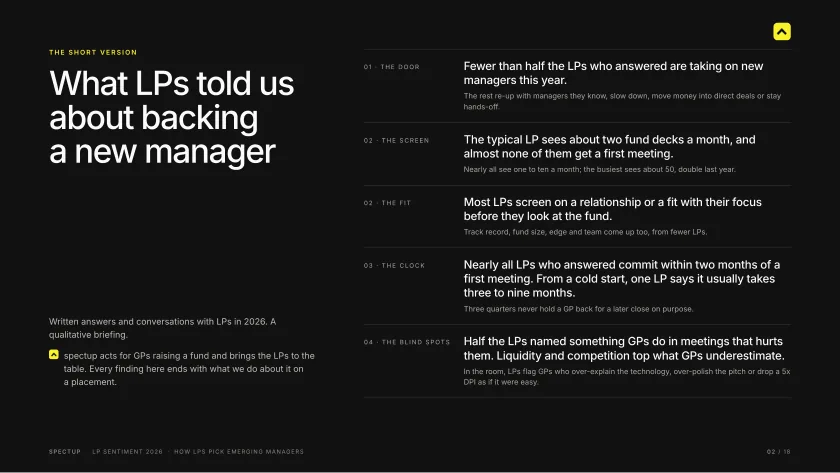
 / 03Study, 2026How LPs pick emerging managersFund decks a month, what earns a first meeting, instant passes and time to commitment. 18 pages, free.



Pitch decks built from the investor's seat.
46% of the 149 decks read as text end without contact details. spectup builds the deck for companies and funds raising capital, then takes it to market.
Weighing providers first? See the pitch deck consultants compared, or the pitch deck design agencies if you need design only.
