


Table of Content
Summary
Understand the 7 core Series A investor metrics
ARR, growth rate, NRR, CAC payback, LTV:CAC, gross margin, and burn multiple, together they reveal investor appeal and business model sustainability.
[01]
Know your Series A benchmarks by metric
$1.5M–$3M ARR, 80-120% YoY growth, 110%+ NRR, <12 month CAC payback, 3:1+ LTV:CAC. Minimum thresholds vary by region and vertical.
[02]
Identify deal-killer metrics before pitch
CAC payback >18 months, NRR <100%, or ARR growth decelerating below 5% monthly kill most Series A rounds. Know which metrics can be improved pre-raise.
[03]
Document metrics for investor audit
Prepare a data room with monthly ARR history, cohort retention curves, CAC by channel, and churn by segment. Investors verify everything.
[04]
Use the readiness checklist to validate alignment
Series A success requires all metrics to align: strong ARR + strong growth + strong unit economics + data integrity + team + TAM story.
[05]
Series A investors have one number in mind: $2 million ARR. But here's what founders get wrong about it. That number isn't a finish line; it's a starting point.
The real question investors obsess over isn't "How much revenue do you have?" but "How fast are you growing?"
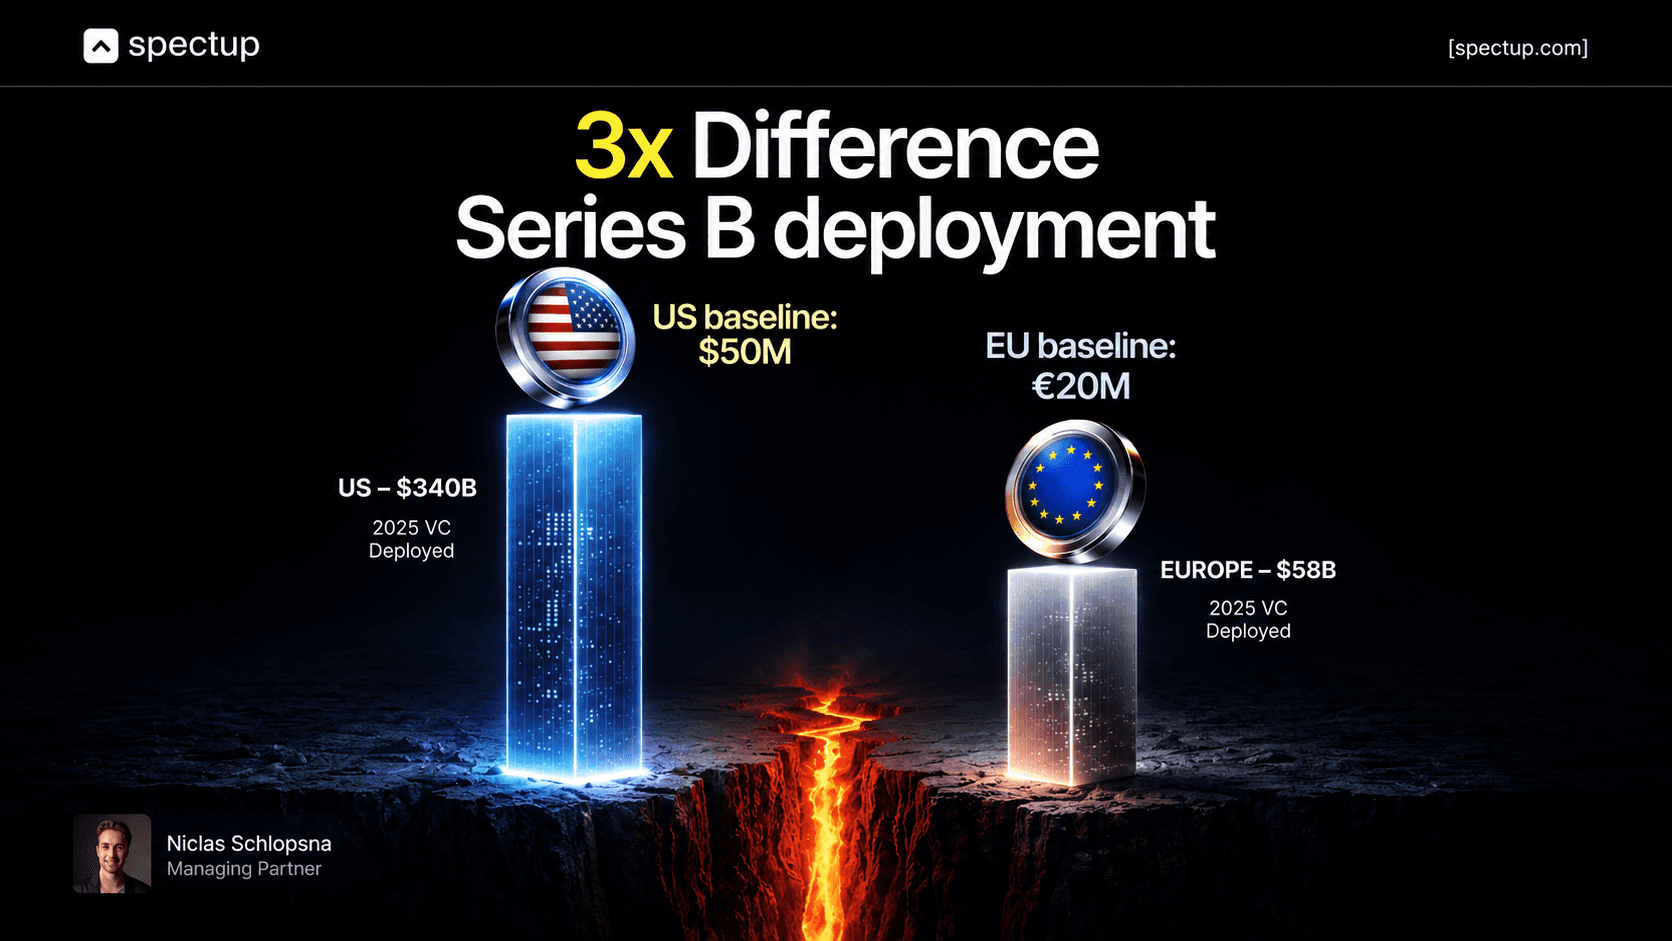
A founder at $1.5 million ARR growing 20% month-over-month beats a founder at $3 million ARR growing 5% month-over-month. Every single time.
In my 150+ client conversations helping founders at spectup's fundraising advisory and through my work evaluating funding metrics at Flashpoint Capital, I've seen this pattern play out repeatedly. Founders focus on hitting a revenue number. Investors focus on the trajectory beneath that number. And when those two things misalign, when a founder is proud of $2 million ARR but reveals a 3% monthly growth rate, the round falls apart.
This post is a field guide to the seven Series A traction metrics investors actually evaluate, the specific benchmarks they use to score your traction, and what to do if your metrics fall short.


The one number series A investors lead with
When a series A investor sits down with a founder, the first metric they ask about is ARR. It's not because the dollar amount itself determines funding; ARR is the threshold gate. The question of how much ARR for series A rounds is essential to understand upfront.
Below $1.5 million ARR, most institutional Series A funds won't engage.
Above $3 million ARR, you're playing in different markets where metrics become more competitive.
But here's where founder psychology breaks down. Once you hit $2 million ARR, it's easy to assume you've "made it" to Series A.
Investors certainly talk about Series A companies having $2-3 million ARR. That language creates a false equivalence: hit the number, close the round. That's not how it works.


Two founders, two scenarios. Founder A built to $2.8 million ARR, growing 7% month-over-month. Founder B is at $1.8 million ARR, growing 25% month-over-month.
Founder A has more revenue. Founder B will raise at a higher valuation.
Why? Because Founder B's trajectory signals a business that's accelerating and will hit $5 million, $10 million, or $20 million ARR within 2–3 years.
Founder A's trajectory signals deceleration. Investors bet on Founder B every time.
The tension here is real: ARR is the anchor metric that qualifies you for Series A conversation, but growth rate is the metric that determines whether investors compete for your round. Your ARR buys you the meeting. Your growth rate wins the deal.
Investors bet on growth momentum, not current revenue. A founder at $1.5M growing 20% monthly is more compelling than one at $3M growing 5%.
- Niclas Schlopsna, Managing Director, spectup
Seven core Series A traction metric investors actually care about:
Series A investors don't evaluate metrics in isolation. They score a founder against a multidimensional checklist. Here are the seven metrics that matter most, what benchmarks mean for 'healthy', and why each one impacts the funding decision.
1. Annual recurring revenue (ARR): the table stakes
Series A ARR benchmarks set the baseline for funding conversations:
$1.5 million minimum, $2.8 million median, $3 million+ for top performers.
ARR is the denominator for almost every other metric investors care about. A $1.5 million ARR company with 100% YoY growth and exceptional unit economics can raise Series A.
A $3 million ARR company with 10% growth and weak unit economics will struggle. But below $1.5 million, most investors won't engage because the risk-to-stage mismatch is too wide.
One critical nuance: your ARR must be real.
Investors define ARR strictly: only contracts with annual terms or contracts that will renew automatically next month.
One-time deals, free trial conversions, and pilot deals don't count.
Channel partnerships that might disappear don't count. I've seen founders claim $2.5 million ARR that shrinks to $1.8 million when investors do the audit. That kills Series A momentum fast.


2. Growth rate (month-over-month or year-over-year): the trajectory
Target: 80-120% year-over-year for Series A stage
Top performers sustain 40–50% annually even at higher ARR ($3 million or more)
Month-over-month growth is easier to game (one big customer skews the number), but it's the metric VCs actually watch.
A consistent 10% MoM growth rate compounds to 214% YoY: that's exceptional.
A consistent 5% MoM growth is 80% YoY; that's Series A territory.
A founder showing 15% MoM growth last month but 3% this month triggers immediate red flags.
VCs expect momentum, not volatility.
The most important pattern I've noticed: Series A rounds almost never close with growth rates below 5% month-over-month.
That floor exists because below it, founders usually aren't raising; they're bootstrapping or adjusting. It's not a hard rule, but it's a pattern strong enough that if you're considering Series A and your growth rate is decelerating toward 5%, accelerate it first.
3. Net revenue retention (NRR): the revenue quality indicator
110% minimum. 120%+ is top tier.
NRR above 100% means your existing customer base is generating more revenue this year than last year, from expansion, upsells, and reduced churn. It's the single strongest predictor of long-term SaaS success, according to SaaS CFO research, because it reveals whether your product sticks and whether customers find enough value to pay you more over time.
Among SaaS series a metrics, NRR has become the most critical benchmark for investor evaluation.
Until about 2023, investors treated NRR as the "nice-to-have" metric. That's changed. NRR is now table-stakes.
Investors want to see 110%+ at Series A.
If your NRR is 105%, you're borderline.
If it's 95%, you have a retention problem you need to solve before raising.
The reason: a company with $2 million ARR and 110% NRR compounds revenue from existing customers at 10% annually, on top of new customer acquisition. That's predictable, sustainable growth. A company with $2 million ARR and 95% NRR is churning faster than it's expanding; it's a treadmill where you're running just to stay in place.
A company with $2M ARR and 110% NRR compounds revenue from existing customers at 10% annually on top of new customer acquisition. That's predictable, sustainable growth.
- Niclas Schlopsna, Managing Director, spectup
4. CAC payback period: the unit economics truth
Under 12 months is healthy. Longer than 18 months is a red flag.
CAC payback is the bridge between sales spend and profitability. Understanding this metric is critical for Series A readiness. If it costs you $5,000 to acquire a customer and they generate $500/month in gross profit, your payback is 10 months. If payback is 18 months or longer, investors ask a hard question: how do you afford to scale? Every dollar of growth costs you money for 18 months before it pays for itself.
Series A investors use CAC payback to detect unit economics problems.
A founder with $2 million ARR but 22-month CAC payback is burning capital to grow, it signals that sales and marketing efficiency needs improvement before Series B.
A founder with $2 million ARR and 8-month payback can scale cheaply; that's a durable business.
One founder mistake I see often: founders calculate CAC payback using net revenue, not gross profit. Net revenue (revenue minus payment processing, hosting costs, etc.) is not the same as gross profit (after all delivery costs).
Using net revenue makes payback look shorter than it is. Investors catch this every time.
5. LTV:CAC ratio: the long-term profitability signal
3:1 minimum. 4:1 is healthy. 5:1+ shows exceptional unit economics.
If CAC payback tells you how quickly you recover acquisition costs, LTV:CAC tells you the total return on that acquisition investment. A 3:1 ratio means every dollar spent acquiring a customer generates three dollars in lifetime gross profit.
A 5:1 ratio means five dollars in return. Among critical series A traction metrics, LTV:CAC is often the strongest predictor of whether your growth is sustainable.
Most Series A companies cluster around 3:1 to 3.5:1.
Top performers hit 4:1 or higher.
Below 3:1, your unit economics are weak, and growth becomes expensive.
Investors see a low LTV:CAC ratio and ask:
If you raise Series A capital, how will you use it to improve margins?
That's usually a difficult answer.
The trap: founders sometimes confuse the LTV:CAC ratio with pure profitability. A 3:1 ratio is strong for unit economics, but it doesn't mean you're profitable on day one.
You still have all the overhead costs (salaries, facilities, product development) that grow with headcount, not revenue. But a strong 3:1 or 4:1 ratio proves your sales and marketing are efficient enough to support that overhead eventually.


6. Gross margin: the scaling viability test
70%+ minimum for pure SaaS
60%+ acceptable for services-heavy SaaS.
Gross margin is revenue minus the cost of goods sold (hosting, payment processing, support, and customer success resources). A SaaS company with 85% gross margin can scale profitably. A SaaS company with a 50% gross margin is constrained; every new customer costs more to serve.
Series A investors care about gross margin because it determines how much capital you need to reach profitability.
A 75% gross margin company needs less total capital than a 55% gross margin company to reach the same absolute profit level. Gross margin also signals whether you're in a defensible market or a commoditized one.
Specific pattern:
Marketplace SaaS and product-heavy, services-light models (like Zendesk or Stripe) have 70–85% gross margins.
Services-blended SaaS (consulting and agency software) runs 50–70%.
These variations are fundamental to how SaaS Series A metrics are evaluated across different business models. Investors expect these ranges.
If your software business has 45% gross margin, investors will ask what's wrong with your delivery model.
7. Burn multiple & capital efficiency: the runway reality
Burn multiple 1.0–1.5x is healthy. Above 2x signals inefficiency.
Burn multiple is your monthly cash burn divided by your monthly revenue growth (in dollars).
If you burn $50,000 per month and grow revenue by $40,000 per month, your burn multiple is 1.25.
If you burn $50,000 and grow revenue by only $20,000, your burn multiple is 2.5.
A burn multiple of 1.5 or below means you're spending $1.50 to generate $1 of new revenue; that's sustainable growth. A burn multiple of 2 or above means you're spending $2 to generate $1 of new revenue; that's unsustainable and signals inefficient sales and marketing.
The capital efficiency ratio (sales and marketing spend divided by new ARR generated) tells the same story from a different angle. A capital-efficient company generates $2–3 of new ARR for every dollar spent on sales and marketing.
An inefficient company generates $0.50–$1.00. Series A Investors always calculate both metrics to triangulate the same insight:
Can this business grow efficiently with reasonable capital, or does it need structural improvement first?
Benchmark table: What does good look like by metric?
This is your scorecard. Here's what healthy Series A traction metrics look like this across all seven metrics. These benchmarks represent 2026 data from active Series A investors, updated quarterly from Benchmarkit, Averi, and venture-firm sourcing.
Metric | Minimum (Qualify) | Median (Target) | Top Performer (Competitive) |
|---|---|---|---|
ARR | $1.5M | $2.8M | $3M+ |
YoY Growth Rate | 80% | 100% | 120%+ |
Monthly Growth Rate | 5% | 8–10% | 15%+ |
NRR | 105% | 115% | 130%+ |
CAC Payback Period | 18 months | 12 months | <8 months |
LTV:CAC Ratio | 2.5:1 | 3.5:1 | 4.5:1+ |
Gross Margin | 60% | 75% | 85%+ |
Burn Multiple | 2.0x | 1.5x | 1.0x |
These numbers are ranges, not hard cutoffs. A company at $1.5M ARR with 150% YoY growth and 4:1 LTV:CAC beats a company at $3M ARR with 20% growth and 2.5:1 LTV:CAC.
Investors weight metrics differently by stage, market, and founder background. But these benchmarks give you a scorecard to self-assess your readiness.
Why are certain metrics deal-killers (and how do you know if you have one)?
Not all metric misses are created equal. Some are negotiable. Some are fatal.
Identifying which weaknesses sink Series A rounds matters more than optimising strong metrics.
Understanding which is which can save you six months of wasted pitches.
A CAC payback period of >18 months is a deal-killer.
Most Series A investors cite unit economics as their top screening criterion. Why? Because it means your unit economics don't work at scale. Investors assume Series A capital will go to sales and marketing.
If every dollar spent on sales and marketing takes 18+ months to recover, you're burning capital to fund growth without a clear profitability path. Most Series A investors walk away.
The rare exceptions:
Founders with exceptional defensibility (strong IP, network effects, locked-in customers)
Founders raising in hot markets where growth is being valued over efficiency.
But in normal markets (2024–2025), CAC payback >18 months is a hard stop
NRR <100% is a retention problem you must fix before Series A.
Leading investors now evaluate cohort retention curves, the core proof of product-market fit. This signals that your customer base is shrinking net of new additions. Investors view NRR below 100% as signalling fundamental product-market fit problems.
You can raise Series A with lower ARR if NRR is strong (110%+).
You cannot raise with weak NRR (<100%), regardless of ARR.
Every Series A investor I know has a rule: NRR >100% or no conversation.
Fix retention first by improving onboarding, reducing time-to-value, implementing customer success workflows, or pruning low-fit customer segments.
ARR <$1.5M with growth rates below 80% YoY requires an exceptional TAM and team story.
Below this threshold, you're betting on founders and market size, not current traction. Most institutional investors won't engage. You might raise from micro-VCs (Khosla Ventures, Lerer Hippeau) or founder-led funds (funds run by operating partners with domain expertise), but Series A from traditional sources gets much harder.
This doesn't mean impossible; I've seen sub-$1.5M ARR Series A Rounds happen, but they require the following:
Explosive growth (120%+ YoY)
Exceptional unit economics (5:1 LTV:CAC)
Either a lightning-in-a-bottle go-to-market or a category-defining founder.
Gross margin declining month-over-month is a red flag.
It usually signals pricing pressure (customers negotiating discounts, moving to lower-tier plans) or delivery cost inflation (support costs rising faster than revenue). Investors ask hard questions about whether this is temporary or structural.
A one-month dip is noise
A three-month declining trend is a problem that needs explaining
Your response matters here: if margin is declining because you're scaling support too early (good problem), that's different from margin declining because your product is becoming commoditized (bad problem).
Growth rate decelerating toward zero is a deal risk.
A founder at $2M ARR growing 10% YoY is less fundable than a founder at $1.2M ARR growing 80% YoY. The question investors ask: if growth is slowing, will it slow further? This becomes especially critical if you've been around for 3+ years and growth is decelerating.
It suggests you're hitting market saturation or have exhausted your easy customer acquisition channels. Series A investors want to fund founders who are accelerating, not ones who've peaked.
The pattern I've noticed across 150+ founder calls: founders underestimate how much single-metric weakness kills momentum. They think, "I'm weak on NRR but strong on growth, so it balances out." It doesn't.
Series A investors have a system. If you fail any one metric badly enough, the round stalls. All metrics must be in the acceptable range simultaneously.
Your weakest metric sets the ceiling for your valuation and may determine whether you raise funds at all.
How to validate and defend your metrics to investors?
Investors don't trust claims. They audit everything in your data room.
Most Series A investors run a standard diligence checklist. Expect these requests:
Monthly ARR reports for 24 months.
Show actual invoices, contracts, and payment history.
Investors will verify that your ARR definition matches their definition. Don't include free trials, pilots, or one-time services.
Don't include expansion revenue you might lose if a customer leaves.
Count only truly recurring, predictable revenue.
These SaaS Series A traction metrics are fundamental to demonstrating business health.
Prepare a single Excel sheet with rows for each month and columns for starting ARR, new customer ARR added, expansion ARR, churn ARR, and ending ARR. This transparency format lets investors see your trends immediately.
Cohort retention curves by acquisition month.
Show your oldest cohorts (customers from 24 months ago) alongside your newest cohorts (from 3 months ago). This is how investors calculate NRR independently and verify whether your claimed retention is real.
If your oldest cohorts have 60% retention and your newest have 90% retention, it's a sign of recent improvement (positive) or changing customer composition due to product changes or GTM shifts (neutral to negative, depending on context).
Investors look for stable or improving retention over time, not declining cohorts masked by new customer growth.
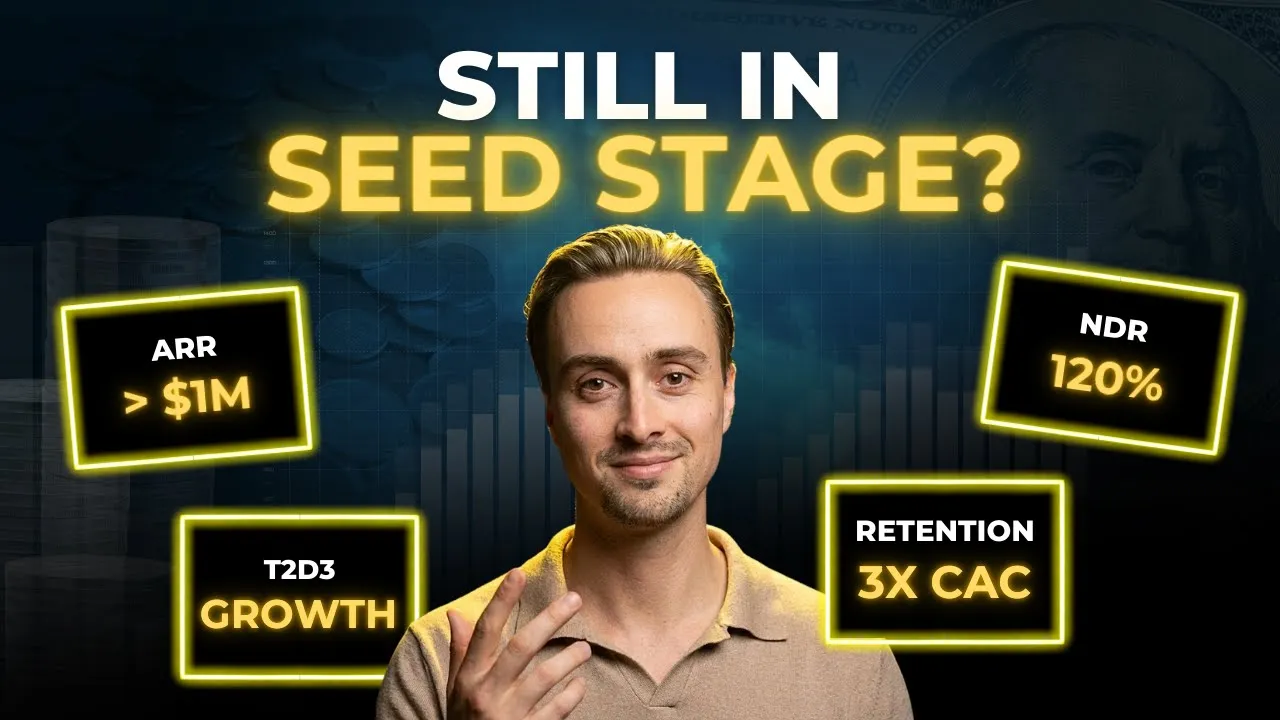
If you are still in the seed stage and looking forward to scaling up your narrative, this video is for you.
CAC calculation breakdown by channel.
Show sales and marketing spend for the past 12–24 months, broken down by acquisition channel (organic, paid ads, partnerships, sales team, events, etc.).
Show customer acquisition counts by channel
Calculate CAC for each channel (spend ÷ customers acquired).
Investors will recalculate independently and verify the payback period.
Hide anything, and they'll distrust your entire metric suite.
Be especially clear about which channels are repeatable and capital-efficient. If your best CAC is from one-time partnerships, that's not defensible at scale.
Churn by customer segment.
Show whether enterprise customers (>$10K ARR) churn differently than SMBs (<$5K ARR), whether customers acquired via sales churn differently than those acquired via marketing, or whether customers from specific geographies have different retention. This reveals whether your business is stable or held up by a few high-value customers who might leave.
If you have one customer that's 15% of your ARR, investors will price in the risk that customer churns. Segment churn lets you prove the business is diversified.
Historical unit economics trend.
Show whether your LTV:CAC ratio, CAC payback, and gross margin are improving or declining over the past 12 months.
Improving trends matter as much as current levels.
A company trending from a 2.5:1 to a 4:1 LTV:CAC over 12 months is more compelling than one flat at 3.2:1, because it shows you're getting more efficient.
Declining unit economics is a major red flag; it suggests scaling is getting more expensive, not cheaper.
Data room structure. A well-organised data room with clear metrics documentation is a core Series A proof point. To understand what you need for Series A success, investors consistently cite data room organisation as evidence of operational rigour.
Create a folder structure with clean labelling:
(1) Financial Metrics (ARR, retention, CAC)
(2) Customer Data (contract list, cohort analysis, churn)
(3) Unit Economics (LTV calculation, gross margin)
(4) Market Data (TAM, addressable segments, growth rates)
(5) Team (bios, relevant experience)
(6) Product (customer lifecycle, feature roadmap, competitive positioning).
Organised data rooms signal disciplined operations. Messy data rooms signal chaos.
One founder mistake: rounding numbers or presenting quarterly aggregates instead of monthly data. Investors see a quarterly ARR report and immediately ask for the underlying monthly data.
Round numbers look suspicious: "$2M ARR" is less credible than "$1,987,400 ARR" because the specific number signals actual customer data, not a guess. Show the actual monthly payments, and you look credible.
Readiness checklist: Are your Series A traction metrics actually aligned?
Beyond individual metrics, Series A readiness is about coherence. All metrics must point in the same direction.
Use this checklist to validate alignment: a company at $2M ARR growing 100% YoY with 110% NRR, 10-month CAC payback, and 3.5:1 LTV:CAC is Series A-ready.
A company at $2.5M ARR with 50% growth, 95% NRR, and 20-month CAC payback will struggle, regardless of absolute revenue.
Revenue Metrics (Minimum to Qualify): What do you need for Series A fundraising?
ARR $1.5M–$3M (or <$1.5M with 150%+ YoY growth and exceptional team)
Growth rate 80-120% YoY (or 5%+ month-over-month)
NRR 110%+ (or documented improvement trajectory toward 110%)
Unit Economics (Non-Negotiable)
CAC payback period <18 months (preferably <12)
LTV:CAC ratio 3:1+ (preferably 3.5:1+)
Gross margin 70%+ (or documented path to 70%)
Burn multiple <2.0x (preferably <1.5x)
Data Integrity (Required Before Pitch)
24-month monthly ARR history with zero gaps or corrections. Investors will compare month-to-month growth and flag any anomalies (e.g., a sudden 40% jump suggests data error or one-time deal)
Cohort retention curves showing oldest and newest customer cohorts. Investors want to see at least 60%+ retention at 12 months for SaaS companies; below 50% is a red flag
CAC by acquisition channel with clear sourcing and verification. If paid ads have $3,000 CAC, partnerships have $1,500 CAC, and sales have $5,000 CAC, show the blended weighted CAC to demonstrate scale efficiency
Churn by customer segment or cohort. If enterprise customers (>$25K ARR) churn at 5% annually but SMBs churn at 30% annually, it reveals whether your unit economics are resilient
Story & Market (Investor Conviction Drivers)
Defensible, quantifiable Total Addressable Market (TAM) ($1B+, preferably $5B+)
Clear product-market fit evidence (NRR >100%, organic growth contribution >30%)
Management team with relevant domain experience or founder-investor fit
Documented customer traction: 50–100+ paying customers with contract values >$5K ARR
If you can check all boxes in the first two sections (Revenue + Unit Economics), you're in Series A territory. If you're missing boxes in the Data Integrity or Story sections, fix those before pitching.
For example: a founder with solid metrics but no cohort retention data will face investor skepticism (investors can't verify NRR claims). A founder with a weak TAM story ($500M TAM) but strong unit economics will struggle to raise from tier-1 VCs. Most deal delays happen because data is weak or the market story isn't compelling, not because the metrics themselves are bad.
Regional and vertical variation: not all series A benchmark is created equal
Series A benchmarks vary by geography and vertical far more than most founders realise. The $2–3M ARR benchmark is an American convention. It doesn't travel.
A European founder optimising for US benchmarks is leaving money on the table. A vertical SaaS founder hitting those metrics is overfunding at a lower valuation than necessary.
US Series A SaaS benchmarks (Silicon Valley, NYC, LA):
$2–3M ARR
100%+ YoY growth
110%+ NRR
<12 month CAC payback
4:1 LTV:CAC
Investors expect aggressive growth and are willing to accept lower profitability or longer burn runways to achieve it. The philosophy is clear: growth first, profitability later.
Median Series A check size: $2–8M. Most US Series A rounds run $3–5M for the upper-middle market.
European Series A benchmarks (London, Berlin, Paris, Amsterdam):
€1.5–2.5M ARR
80-120% YoY growth
110%+ NRR
<15 month CAC payback
3.5:1 LTV:CAC
European investors emphasise path-to-profitability more than US investors. Data shows European Series A companies must demonstrate a clear path to profitability within 18 months. Burn multiples are scrutinized more carefully.
The European investor thesis is different: they want to see that a company can scale profitably, not just scale. This doesn't mean slow growth; it means efficient growth.
A company with 90% YoY growth, 120% NRR, and 1.2x burn multiple looks better to European investors than a company with 150% growth, 105% NRR, and 2.5x burn multiple.
For more on how Series B requirements differ, including regional nuances, see our full breakdown.
Median Series A check size: €1.5–4M
Top-tier European VCs (Accel, Balderton, Northzone) deploy larger checks ($4–10M), but the efficiency bar is still higher than US investors set.

Vertical SaaS benchmarks:
Can raise Series A at $800K–$1.5M ARR if growth rate is 80%+ YoY and NRR is strong.
Vertical SaaS serves a deep, concentrated market (e.g., healthcare practice management, legal billing, and construction project management).
Investors accept lower absolute revenue because the addressable market is smaller but more defensible. A vertical SaaS company at $1.2M ARR with 100% growth and 130% NRR is often more fundable than a horizontal SaaS company at $2M ARR with 60% growth and 100% NRR.
The vertical play signals stronger product-market fit in a narrower market. Median Series A check for vertical SaaS: $1–3M.
B2C and marketplace benchmarks:
User growth rates and engagement metrics (DAU/MAU, retention curves, LTV) matter more than ARR. Series A investors in consumers usually prioritise product-market fit (retention cohort curves) over profitability metrics.
Some B2C SaaS raises Series A with less than $1M ARR if viral coefficient or organic growth rate is exceptional. Marketplaces care about network effects and GMV growth, not ARR.
A marketplace at $500K ARR but 200% YoY GMV growth with strong unit economics can raise Series A from the right investor. Median Series A check for consumer: $2–6M, but the range is wider because investor appetite for consumer companies is more volatile.
Down markets (2023–2025):
Series A benchmarks tighten across the board. Investors raised Series A requirements to $2.5M+ ARR with growth rates >100% YoY and unit economics of 3.5:1+ LTV:CAC. In hot markets, benchmarks loosen significantly. In 2021, some Series A companies were funded at $500K ARR with 50% growth. That doesn't happen in 2025.
Understanding Series A requirements for 2026 is essential for current fundraising planning. These thresholds shift with venture capital availability, so re-check them quarterly against current market reports (Benchmarkit and Averi publish quarterly updates).
The trend through 2024–2025 has been toward tighter unit economics requirements and lower tolerance for growth-at-all-costs narratives. Plan for the current market, not the market from 2021.
Common metric mistakes that kill series A rounds
After dozens of founder calls, I've identified patterns in Series A traction metrics – mistakes that kill momentum. These are worth knowing before you pitch. Most aren't intentional deceptions; they're honest oversights.
But investors don't care about intent. They care about accuracy. A metric that's wrong loses trust faster than one that's weak but honest.
Mistake 1: Inflating LTV with unrealistic assumptions.
Conservative LTV calculations based on actual cohort data are the only credible approach. The founder calculates LTV as $1,000 per customer over a lifetime, assuming 5-year retention and 20% annual expansion. Reality: their oldest cohorts (3 years old) have 50% retention and 5% expansion. Investors recalculate independently and find LTV is actually $400.
The gap signals either overconfidence or deception.
What do you need for Series A credibility? Accurate, conservative unit economics.
The investor's response: if you can't accurately model customer lifetime, how can we trust your growth projections?
Mistake 2: Cherry-picking CAC by excluding your worst channels.
The founder calculates CAC as $2,000 based on paid advertising performance, which looks strong. Investor asks:
What about your sales team CAC? Sales team CAC is $8,000, but it's early and small volume.
What about partnerships? Partnerships have 3x CAC.
Weighted across all channels, actual CAC is $5,000.
Excluding entire acquisition channels is a red flag for credibility. Investors always ask for a full CAC breakdown by channel.
Mistake 3: Not tracking cohort retention properly.
The founder claims 95% monthly retention, then admits they haven't tracked retention by cohort; they've averaged it across all customers. But the company doubled in size 6 months ago, so newer cohorts skew the retention rate upward.
Oldest cohorts might be at 80% retention. VCs always ask for cohort curves. If you don't have them, you haven't been serious about measuring retention. Worse, cohort analysis reveals the dirty truth:
Are retention rates improving over time (good signal), declining (bad signal), or flat (concerning given your newer cohorts have higher NRR due to recency bias)?
Learn how to structure your data room correctly in our investor metrics guide.
Mistake 4: Claiming NRR >100% based on one large customer expanding.
The founder says NRR is 115% because one enterprise customer increased their contract size by 30%. But that's not NRR; that's one data point. NRR should be calculated across the entire customer base for a 12-month lookback.
A customer who expands dramatically but then churns at the end of year 1 doesn't actually generate 115% NRR. Even worse, if NRR is driven by one customer, the business is fragile.
Investors immediately ask:
If that customer churns, what does your NRR look like?
If it drops to 98%, you have a concentration risk that will be a red flag for Series B.
Mistake 5: Calculating growth rate from inconsistent baselines.
The founder says, "We grew from $1M to $2M in 6 months; that's 100% growth." But an investor calculates year-over-year growth from the same month last year and sees 40%.
Which number is real?
Both are; they're just measuring different things.
A 6-month growth rate is not comparable to a 12-month growth rate. Always use consistent, calendar-aligned growth periods (month-over-month or year-over-year) and call out what you're measuring.
Mistake 6: Misdefining "ARR" to include services revenue or one-time deals.
Founder includes one-time implementation fees in ARR or counts 12-month support contracts that won't renew. Investors ask:
How much of your ARR is truly recurring?
Real ARR includes only contracts that will renew or have automatic renewal terms. Everything else is lumpy revenue.
A company claiming $2M ARR that's actually $1.5M recurring + $500K one-time services loses credibility instantly.
The foundational issue beneath all these mistakes: founders optimise for the pitch rather than for truth. They calculate metrics that make the best case, hoping investors won't dig deeper. Investors always dig deeper.
The safest path is to calculate metrics conservatively, verify them independently using a third-party audit, and be prepared to defend every assumption. Honesty about weakness beats false strength every time.
The bottom line: align your metrics to raise Series A.
Series A investors don't need all metrics to be perfect. They need all Series A traction metrics to be aligned. A founder with $2M ARR, 10% monthly growth, 105% NRR, 14-month CAC payback, and 3.2:1 LTV:CAC is Series A-ready even though no single metric is exceptional.
All metrics are in range, and together they signal a stable, growing, reasonably efficient business.
Conversely, a founder with $3M ARR (excellent), but 80% NRR (poor), 22-month CAC payback (poor), and 2.2:1 LTV:CAC (weak) will struggle in Series A conversations. The high ARR doesn't redeem the weak metrics. Investors see an unsustainable unit economics problem that needs fixing.
The checklist in this post is your roadmap. Use it to diagnose where you stand. Focus on whichever metrics are weakest; those are your constraints.
Fix unit economics first (CAC payback and LTV:CAC)
Then focus on retention (NRR)
Then focus on growth (ARR and growth rate)
Series A happens when all metrics align.
If you're working through your metrics and finding gaps or weaknesses, that's normal. Most founders do. The question is whether you're 6–12 months away from Series A readiness or whether your unit economics require structural changes.
A quick audit can tell you which. If you'd like to discuss your specific metrics and roadmap, a fundraising consultant can help you validate alignment and identify structural fixes. Or visit spectup for our full range of fundraising advisory services.
Which metric matters most for Series A fundraising?
NRR (Net Revenue Retention) has emerged as the strongest predictor of long-term Series A success since 2023.
It's now the most reliable signal for investors across all benchmarks. Investors evaluate all seven metrics, but if you have one to optimise before pitching, optimise NRR first.
Can weak metrics be offset by a strong team or market? Partially.
Exceptional founders or a massive TAM can sometimes compensate for one weak series. A traction metrics benchmark, but only if all other metrics are solid. Weak unit economics (CAC payback >18 months) is rarely forgiven regardless of team or market size.
Build towards metric alignment, not metric perfection
No founder hits every Series A benchmark simultaneously – the goal is metric alignment, not metric perfection. A $2M ARR business with 10% monthly growth, 105% NRR, and 14-month CAC payback is fundable even though no single number is exceptional, because everything points in the same direction.
Use the checklist in this post as a diagnostic, not a report card. Identify the two or three metrics that are furthest from the benchmark and fix those first, because those are the constraints blocking your round. Fix unit economics before retention, and retention before growth rate.
When your metrics align, the fundraising conversation changes from defending weaknesses to fielding competing term sheets.
If you'd like a specific audit of your current metric stack, spectup's fundraising advisory helps founders identify exactly what needs to move, and how fast, to get Series A-ready.
Concise Recap: Key Insights
Trajectory beats absolute ARR.
Investors bet on growth, not current revenue. A founder at $1.5M growing 20% monthly is more compelling than one at $3M growing 5%.
Unit economics are non-negotiable.
CAC payback >12 months, LTV:CAC <3:1, or NRR <100% kill most Series A rounds outright. Fix these metrics first before pitching, or delay your round until unit economics improve.
Not all metrics are fixable quickly
NRR and retention are lagging indicators. You can't improve them by next month. Plan ahead or raise on other metrics.
Frequently Asked Questions
How much ARR do you need for series A?
Series A companies typically raise at $1.5M–$3M ARR, with $2–2.8M as the median target and top performers at $3M+. Trajectory matters as much as the absolute number: a founder at $1.5M growing 20% monthly is consistently more compelling to investors than a founder at $3M growing 5%.

