

Table of Content
Summary
The blog on Series A traction metrics outlines essential benchmarks VCs evaluate for funding readiness.
These points highlight key discussions tailored for founders seeking investor confidence
[01]
Series A traction metrics emphasize achieving $100K+ MRR or $1.2M+ ARR with 3x YoY growth and burn multiple below 1.5x, signaling scalable revenue engines
[02]
Strong series A traction metrics require Net Revenue Retention (NRR) over 100% alongside logo retention, proving customer loyalty and upsell potential that top capital providing companies prioritize.
[03]
Series A traction metrics demand 75-85%+ gross margins for SaaS or efficient take rates in marketplaces, demonstrating cost control and profitability trends for capital raising
[04]
Key series A traction metrics include CAC payback under 12 months with channel breakdowns, showing acquisition efficiency that fundraising consulting firms analyze for sustainable growth
[05]
Moving onwards, when the startup industry is greatly influenced by AI and new virtual realities, there is still a lack of understanding about what Series A investors are looking for when it comes to funding. Many entrepreneurs find it confusing after receiving angel funding and seed rounds from venture capitalists. However, Venture Capitals closely examine every metric to assess the potential and profitability of an investment, when it comes to Series A metrics.
If you’re skimming, the first two paragraphs are enough to understand the scenario.
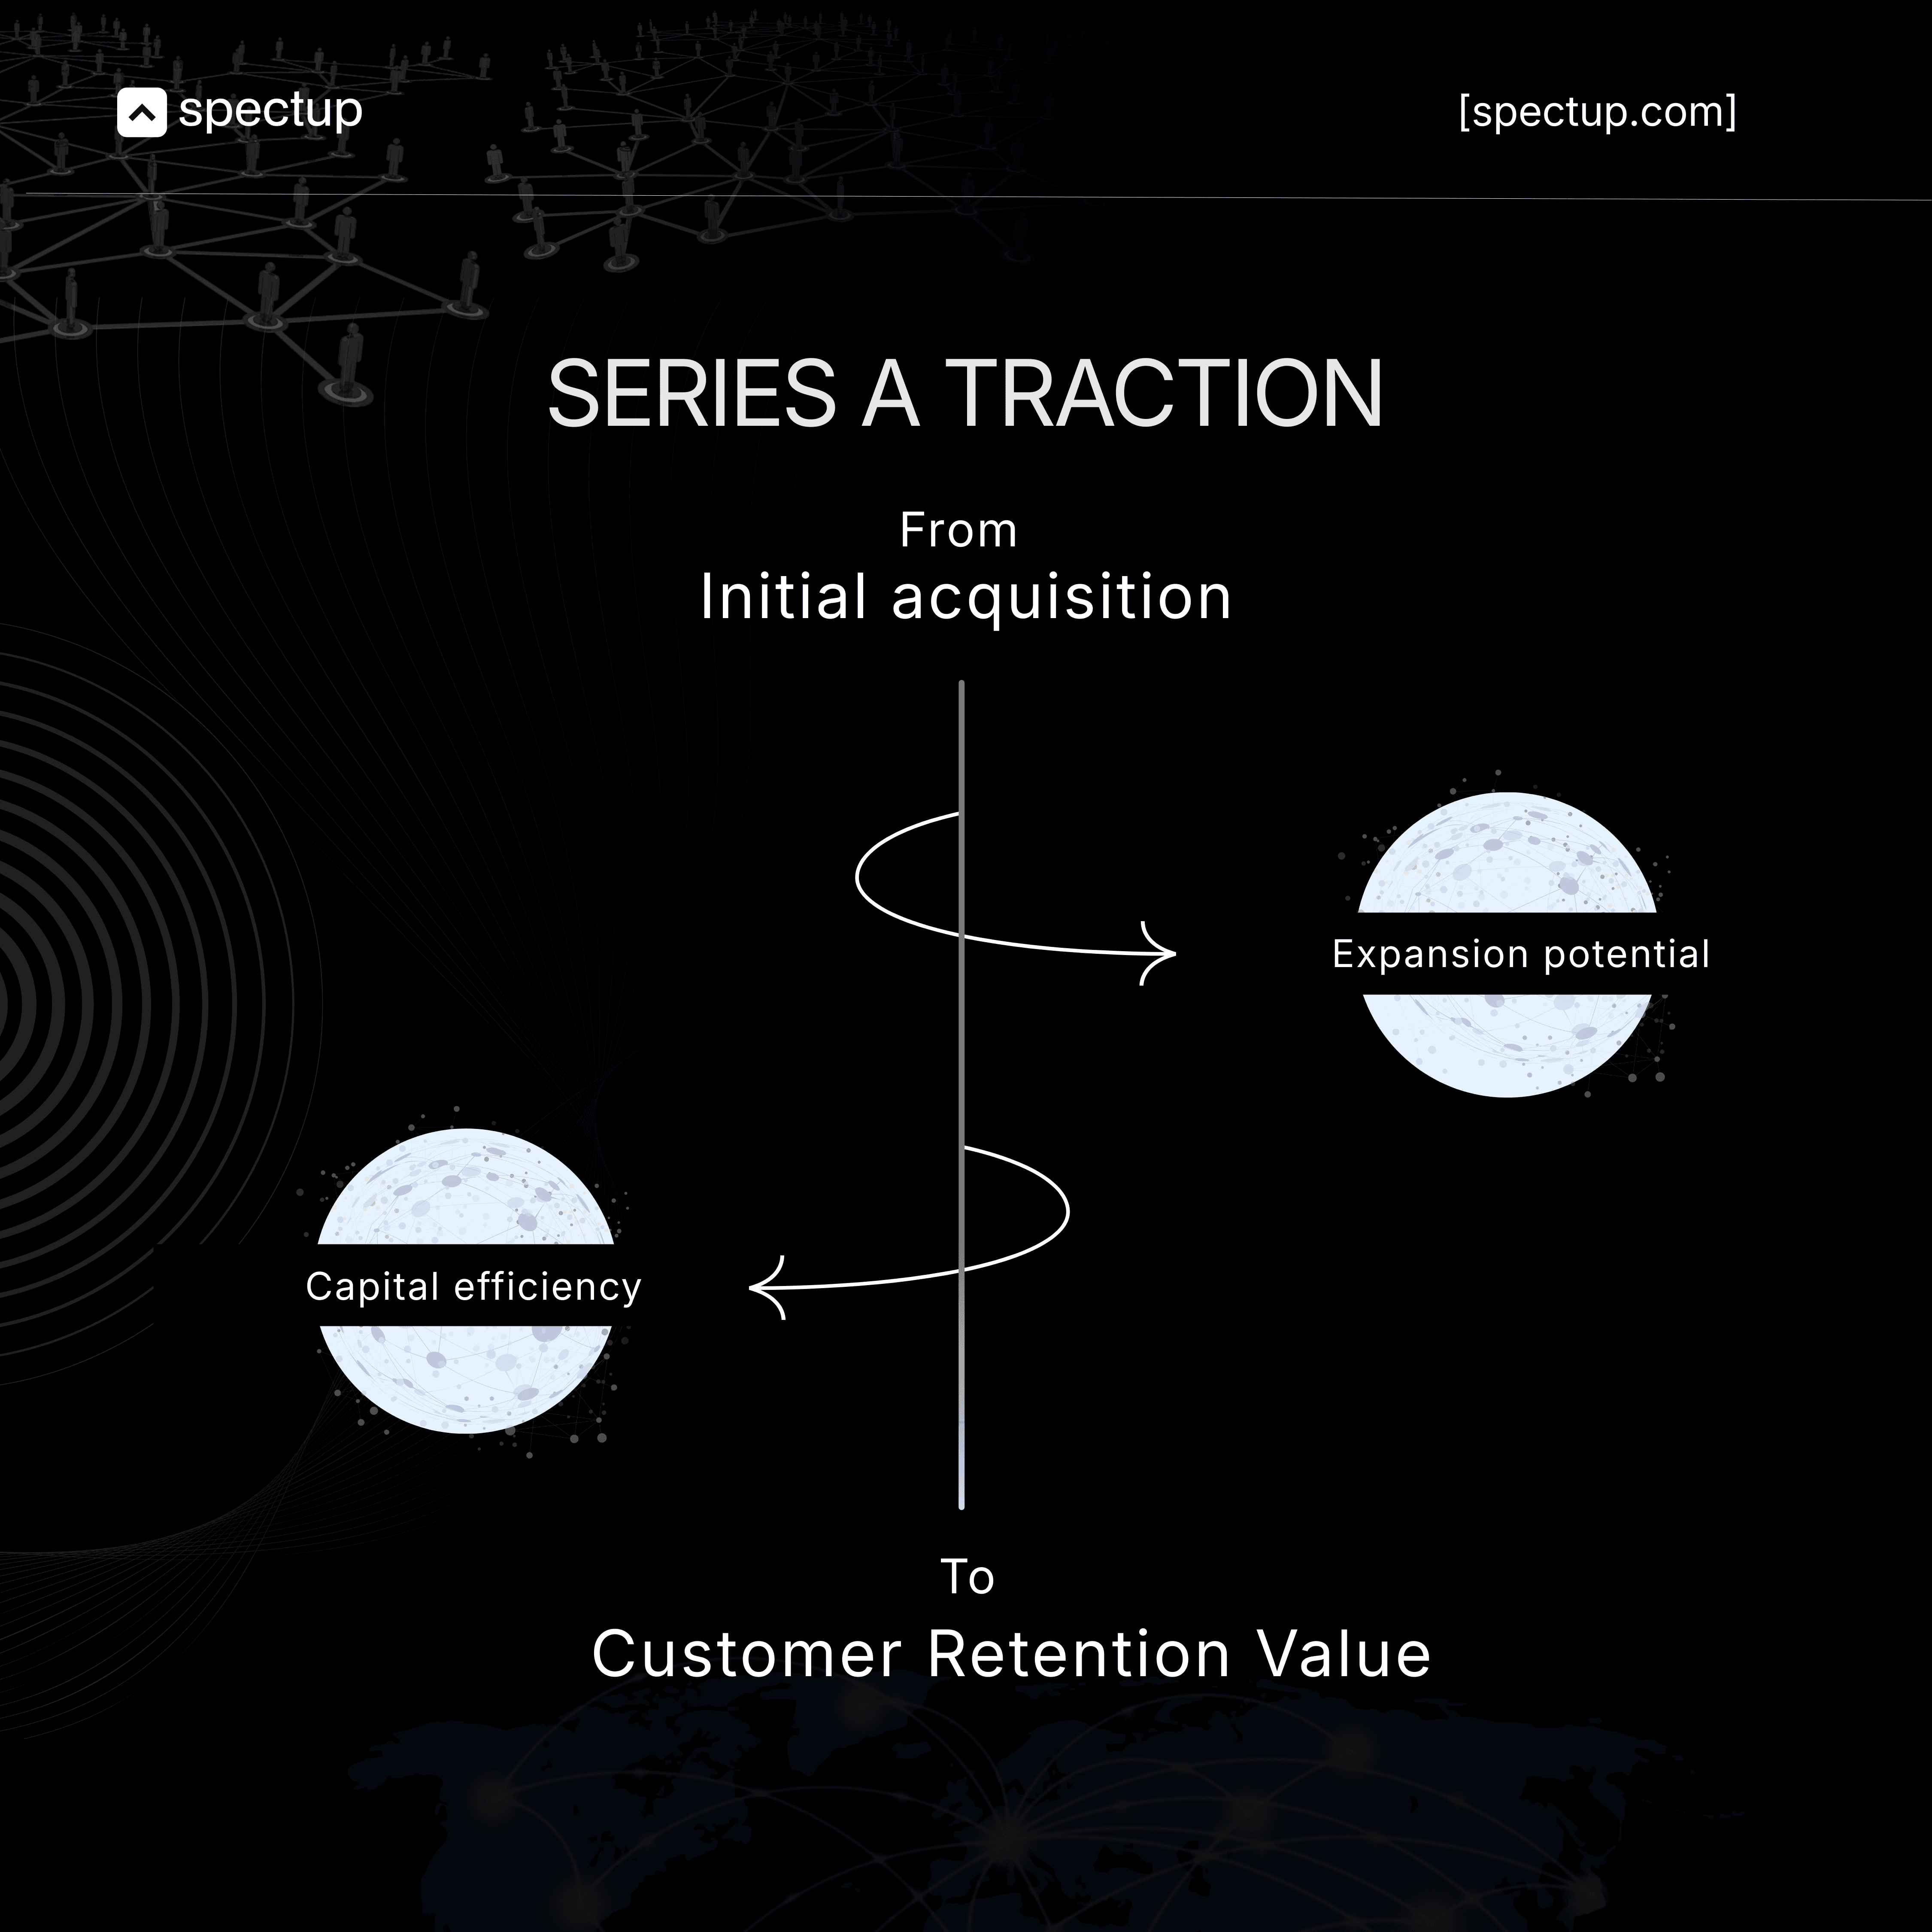
At Seed, investors bet on what could happen. At Series A Funding Round, they fund what already does happen, consistently.
While working with startups, spectup has observed that the shift from potential to proof is everything. There are some key metrics that bridge these scenarios, while making sure that your deal is not slipped away.
Seed investors fall in love with your vision, your team, and the targetted market opportunity. They're writing checks on faith that you'll figure it out. However, this is not the case in terms of Series A investors, who are entirely looking for the evidence. They want to see traction that repeats, unit economics that work, and growth that's predictable. In short, they are willing to invest in the track record.
This is why founders who nail their Series A have numbers that tell the story for them
Revenue growing month over month.
Customer acquisition costs that make sense.
Retention rates that prove people actually want what you're building.
And if you are using this as your winning strategy, these are your credibility as an operator.
If you can't articulate which metrics matter most for your business and why they're trending in the right direction, you're not ready for Series A.
Now, if you are an avid reader, this the clear break down that scrutinize the deals and the understanding of how to position them for maximum impact while you connect with investors.
Why Series A Traction Matters So Much?
Series A funding marks the initial round of institutional venture capital investment for startups. In the Series A phase, investors inject capital into the company in return for equity.
This equity, known as preferred equity, grants Series A investors precedence in repayment (compared to common stock), liquidation preferences, and board rights.
When VCs talk about Series A traction metrics, the whole criteria to judge and scrutinize is to find out the story of momentum and potential. The primary focus of every investor or venture capitalist is that the startup metrics reflect consistent revenue growth, backed by repeatable engine.
Think of it as Angel and Seed rounds are like showing a sketch of a car and saying,
"Imagine how fast this could go."
Series A is when investors pop the hood to check:
Does the engine actually work? (revenue model)
Is it fuel-efficient? (unit economics)
Can it survive long drives? (retention + churn)
Can this be manufactured at scale? (repeatable growth)
Traction acts as a risk filter by:
Demonstrating product-market fit with real, paying customers.
Validating demand in your target market.
Lowering the execution risk investors worry about.
Helping predict future performance with confidence using VC metrics checklist essentials like MRR benchmarks Series A, CAC payback period SaaS, and LTV to CAC ratio.
These terms looks entirely boring but assume, these are the fundamentals that can make you secure or lose the deal forever.
Now, understanding how to present traction in a pitch deck means you’re ready to show startup financial metrics for fundraising that matter and that sells your vision effectively.
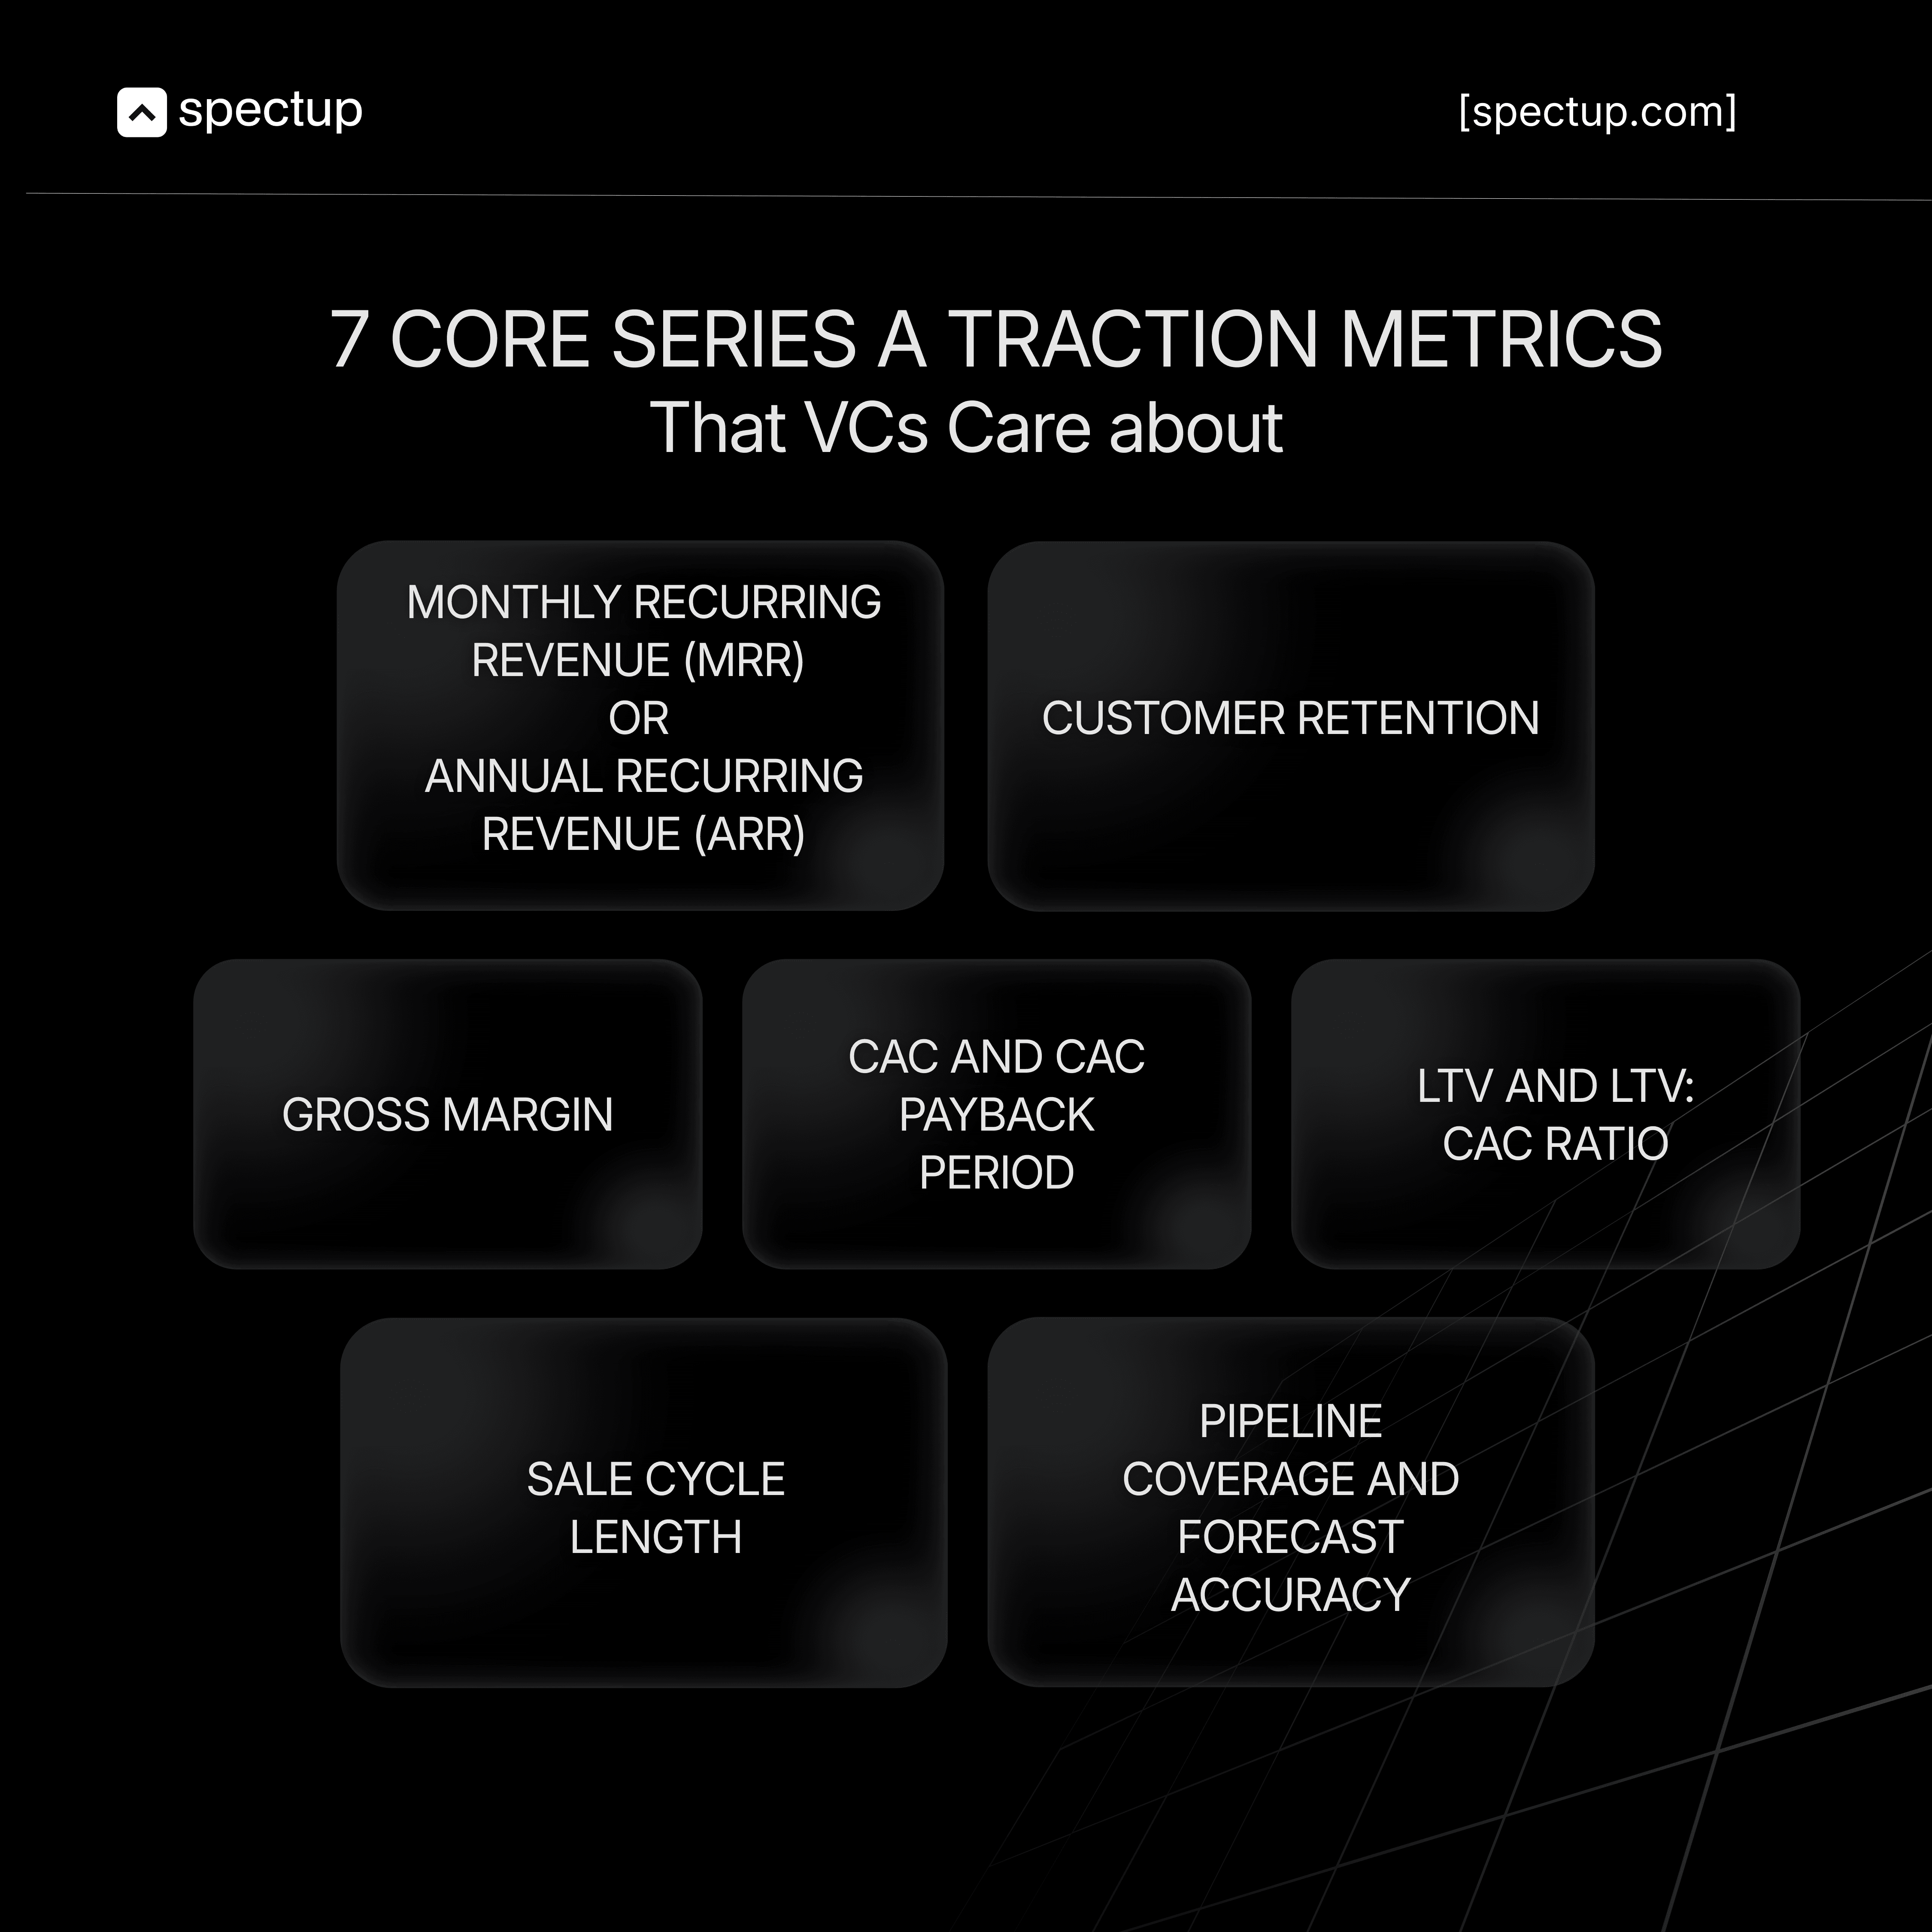
Here are the 7 Core Series A Traction Metrics that Venture Capitals Care About:
Just as a mechanic doesn't check every bolt when inspecting a car, Series A investors zero in on specific metrics that reveal whether your startup has what it takes to scale. These are the vital signs that show your engine works, your fuel economy makes sense, and your vehicle can handle the highway ahead.
While these metrics provide a clear picture of the startup's financial health, growth potential, and market fit, crucial for attracting Series A investors, it's equally important to consider the emotional intelligence in startup leadership.
This aspect can significantly influence decision-making processes and ultimately impact the success of the startup while capital raising.
Monthly Recurring Revenue (MRR) or Annual Recurring Revenue (ARR):
When discussing Series A traction metrics, it’s essential to focus on key benchmarks like:
Achieving $100K+ MRR
Or $1.2M+ ARR.
These figures serve as crucial traction metrics for startups that can significantly influence Series A investor expectations.
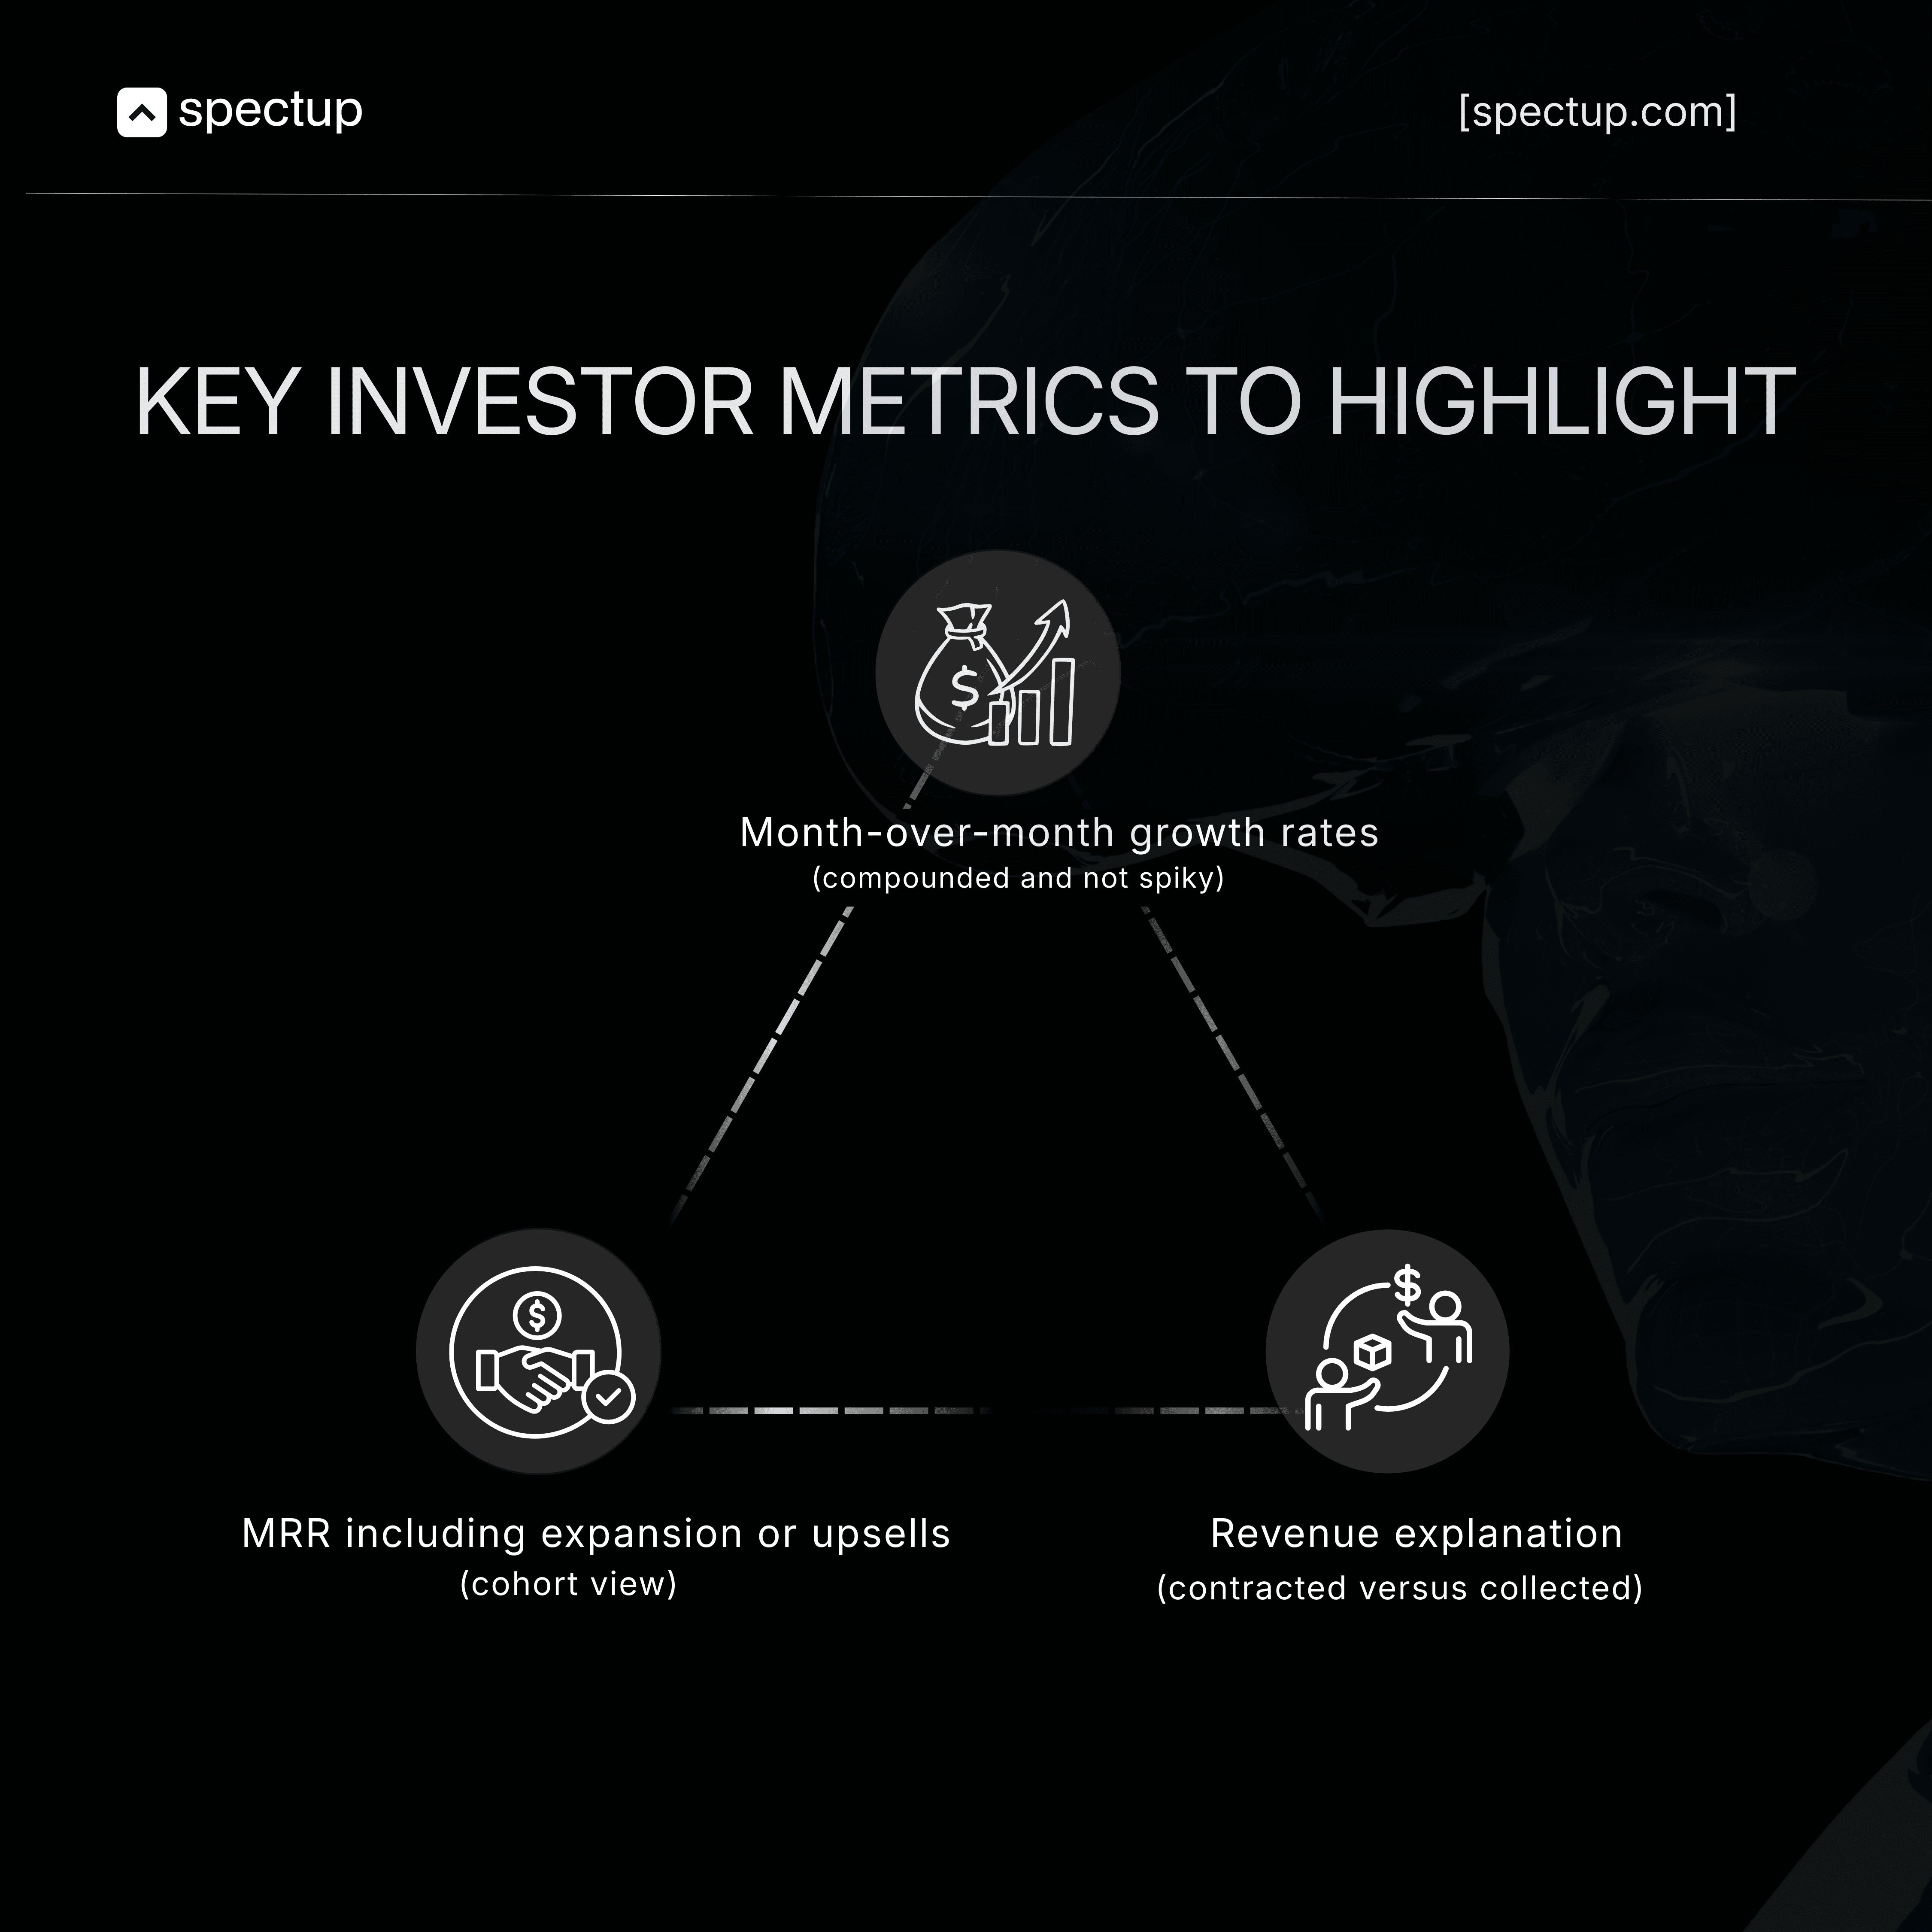
Key Metrics to Highlight under Monthly Recurring Revenue (MRR) or Annual Recurring Revenue (ARR):
1. Revenue: Does Your Engine Actually Run?
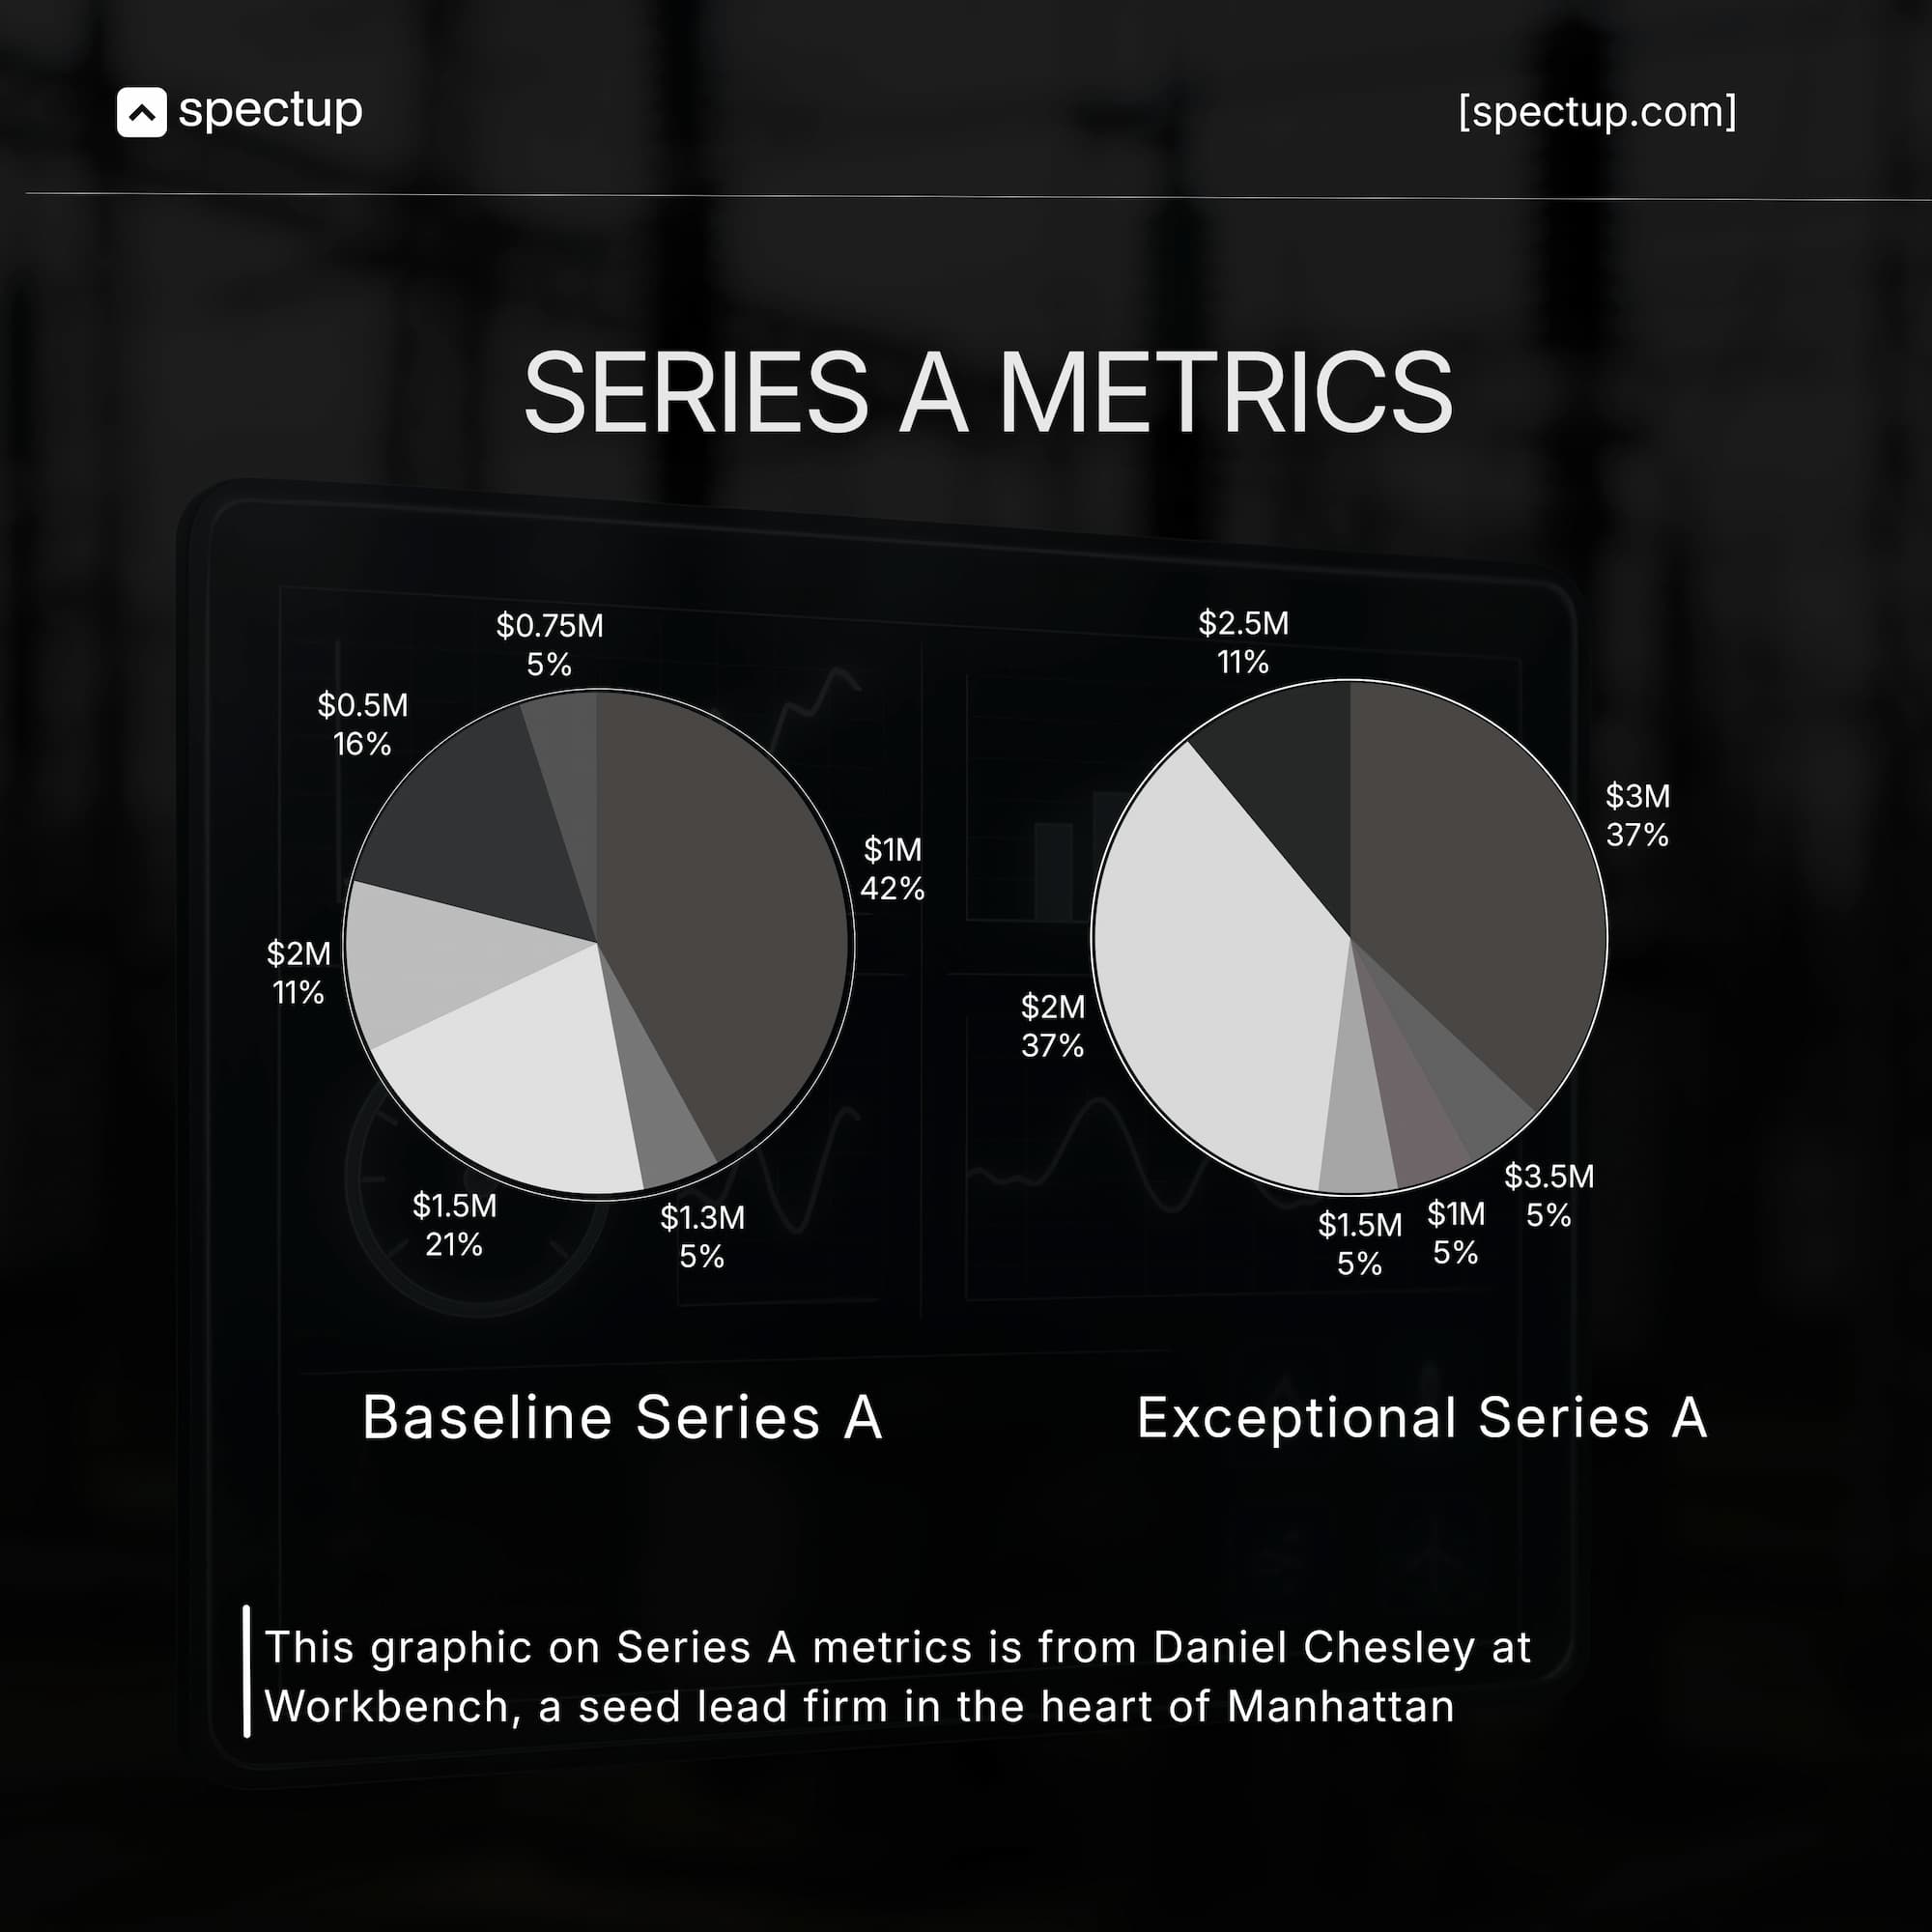
The benchmark: $2M+ ARR (Annual Recurring Revenue)
There was a time when 2 Million in ARR was thought as the finish line, however, the case is entirely opposite now. It's the starting block.
While some companies squeeze through at $1M, the deals getting done today cluster around $2M or higher. Think of this as proof your engine doesn't just turn over, it runs consistently under load.
Why this matters?
ARR shows you've moved beyond beta customers doing you favors. You're generating real, repeating revenue that investors can model forward.
2. Growth Rate: Can This Car Actually Accelerate?
The benchmark: 3x year-over-year growth (300% YoY)
Doubling revenue sounds impressive until you're sitting across from a VC who's seen twenty pitches this week. The companies landing term sheets aren't growing 80% or 100% year-over-year, they're tripling. This change might look swift but due to emergence of AI as a convenient tool, companies are growing with alot more speed than usual.
Why this matters:
3x growth signals two things.
Your sales engine is improving.
You've nailed your Ideal Customer Profile and know exactly who to target.
Slow and steady doesn't win Series A. Rapid acceleration of startups is the key benchmark.
3. Capital Efficiency: What's Your Fuel Economy?
The benchmark: Burn multiple below 1.5x
Your burn multiple, net burn divided by ARR added, tells investors how much cash you're torching to generate each dollar of revenue. Keep it under 1.5x. Better yet, get it below 1x.
Why this matters:
A low burn multiple means you're not flooding the engine with cash just to keep it running. You've figured out how to grow efficiently, which means investor capital will go toward scaling.
The lower this number, the more investors lean in.
4. Sales Velocity: How Many Miles Per Tank?
The benchmark: 4-6 new deals monthly with $50K+ ACV
According to recent surveys of top-performing Series A companies, the winners are closing 4 to 6 new customers every month, each worth at least $50K annually. Ultimately, we can say gone are the days, when startups used to chase small deals. Now, every startup has upmarketed deliberately.
Why this matters:
High-value deals prove you can sell to real businesses with real budgets.
Small $10K or $25K contracts might feel good early on, but they signal you're still in the shallow end.
Series A investors want to see you swimming with bigger fish. Save the long-tail customers for after you IPO, right now, focus on deals that move the needle.
Other Critical Aspects to Consider in MRR & ARR:
MRR benchmarks specific to Series A
CAC payback period in SaaS businesses
LTV to CAC ratio
These startup financial metrics for fundraising are invaluable when preparing your pitch deck. If you are having issues, have us as your financial modeling experts.
Furthermore, retention metrics for Series A, sales pipeline coverage, and a comprehensive VC metrics checklist are all essential components that can help present a robust case for your startup's potential during the fundraising process.
Customer Retention (Logo + Revenue) as a Series A Traction Metric:
The benchmarks: Logo retention + Net Revenue Retention (NRR) over 100%
Investors check two retention numbers.
Logo retention measures how many customers stick around, the percentage who don't cancel.
Revenue retention shows whether the customers who stay are spending more over time.
The gold standard: NRR above 100%
When your Net Revenue Retention exceeds 100%, you're telling investors something powerful:
Even if you stopped acquiring new customers tomorrow, your revenue would still grow.
Existing customers are expanding their usage, upgrading plans, or buying additional products.
This could only mean, you have acquired enough fundamentals that your startup will keep growing.
Here is how NRR in Series A metrics matters:
High retention proves customers actually need what you've built. It's not a nice-to-have they'll cut when budgets tighten.
Low retention is a flashing check-engine light that signals product-market fit issues no amount of growth can mask.
Pro tip: Segment these metrics by customer type, plan tier, or industry. If your enterprise customers have 120% NRR while SMBs churn at 80%, that tells investors exactly where to scale, and where not to waste fuel.
Gross Margin to check out What's Your Profit Per Mile?
The benchmarks: 75-85%+ for SaaS | Strong take rate + efficiency for marketplaces
Gross margin measures what's left after you subtract the direct costs of delivering your product (COGS) from revenue. It's essentially your profit per mile driven, how much value you capture after covering the basics like hosting, support, and infrastructure.
For SaaS companies:
Target 75% to 85% or higher. This tells investors you've figured out how to deliver your product efficiently and can scale without costs spiraling.
Lower margins suggest you're burning too much fuel relative to the distance traveled.
For marketplaces:
Gross margin alone doesn't tell the full story. Investors also want to see your take rate (the percentage you keep from each transaction) and operational efficiency.
How much are you spending to facilitate transactions, and how does that scale as volume grows?
Show the trend in Series A traction metrics, not just the snapshot
If your gross margin is climbing over time, make that visible. Improving margins prove:
You're getting more efficient as you grow
Negotiating better infrastructure deals
Optimizing cloud spend
Reducing support costs through better onboarding.
If margins are slipping, be ready to explain why.
Rising customer support costs because you're growing fast? Show your plan to address it with self-service tools or better documentation.
Infrastructure costs creeping up? Walk investors through your optimization roadmap.
These metrics might look hard to understand but revealing these helps investors understand whether your business model actually works at scale. A company with 40% gross margins might look healthy today, but investors know that when you pour gas on growth, thin margins become a bonfire of cash.
High margins mean you can afford to step on the accelerator without the engine overheating.
Gross margin is a critical metric that investors look at when evaluating a startup's financial health. It represents the percentage of revenue that exceeds the cost of goods sold (COGS), indicating how efficiently a company produces and sells its products or services.
CAC and CAC Payback Period - How Quickly Do You Recoup Your Investment?
The benchmark: Under 12 months
CAC (Customer Acquisition Cost) is a crucial metric for startups, especially when preparing for a Series A funding round. It represents the cost associated with acquiring a new customer and is calculated using the formula.
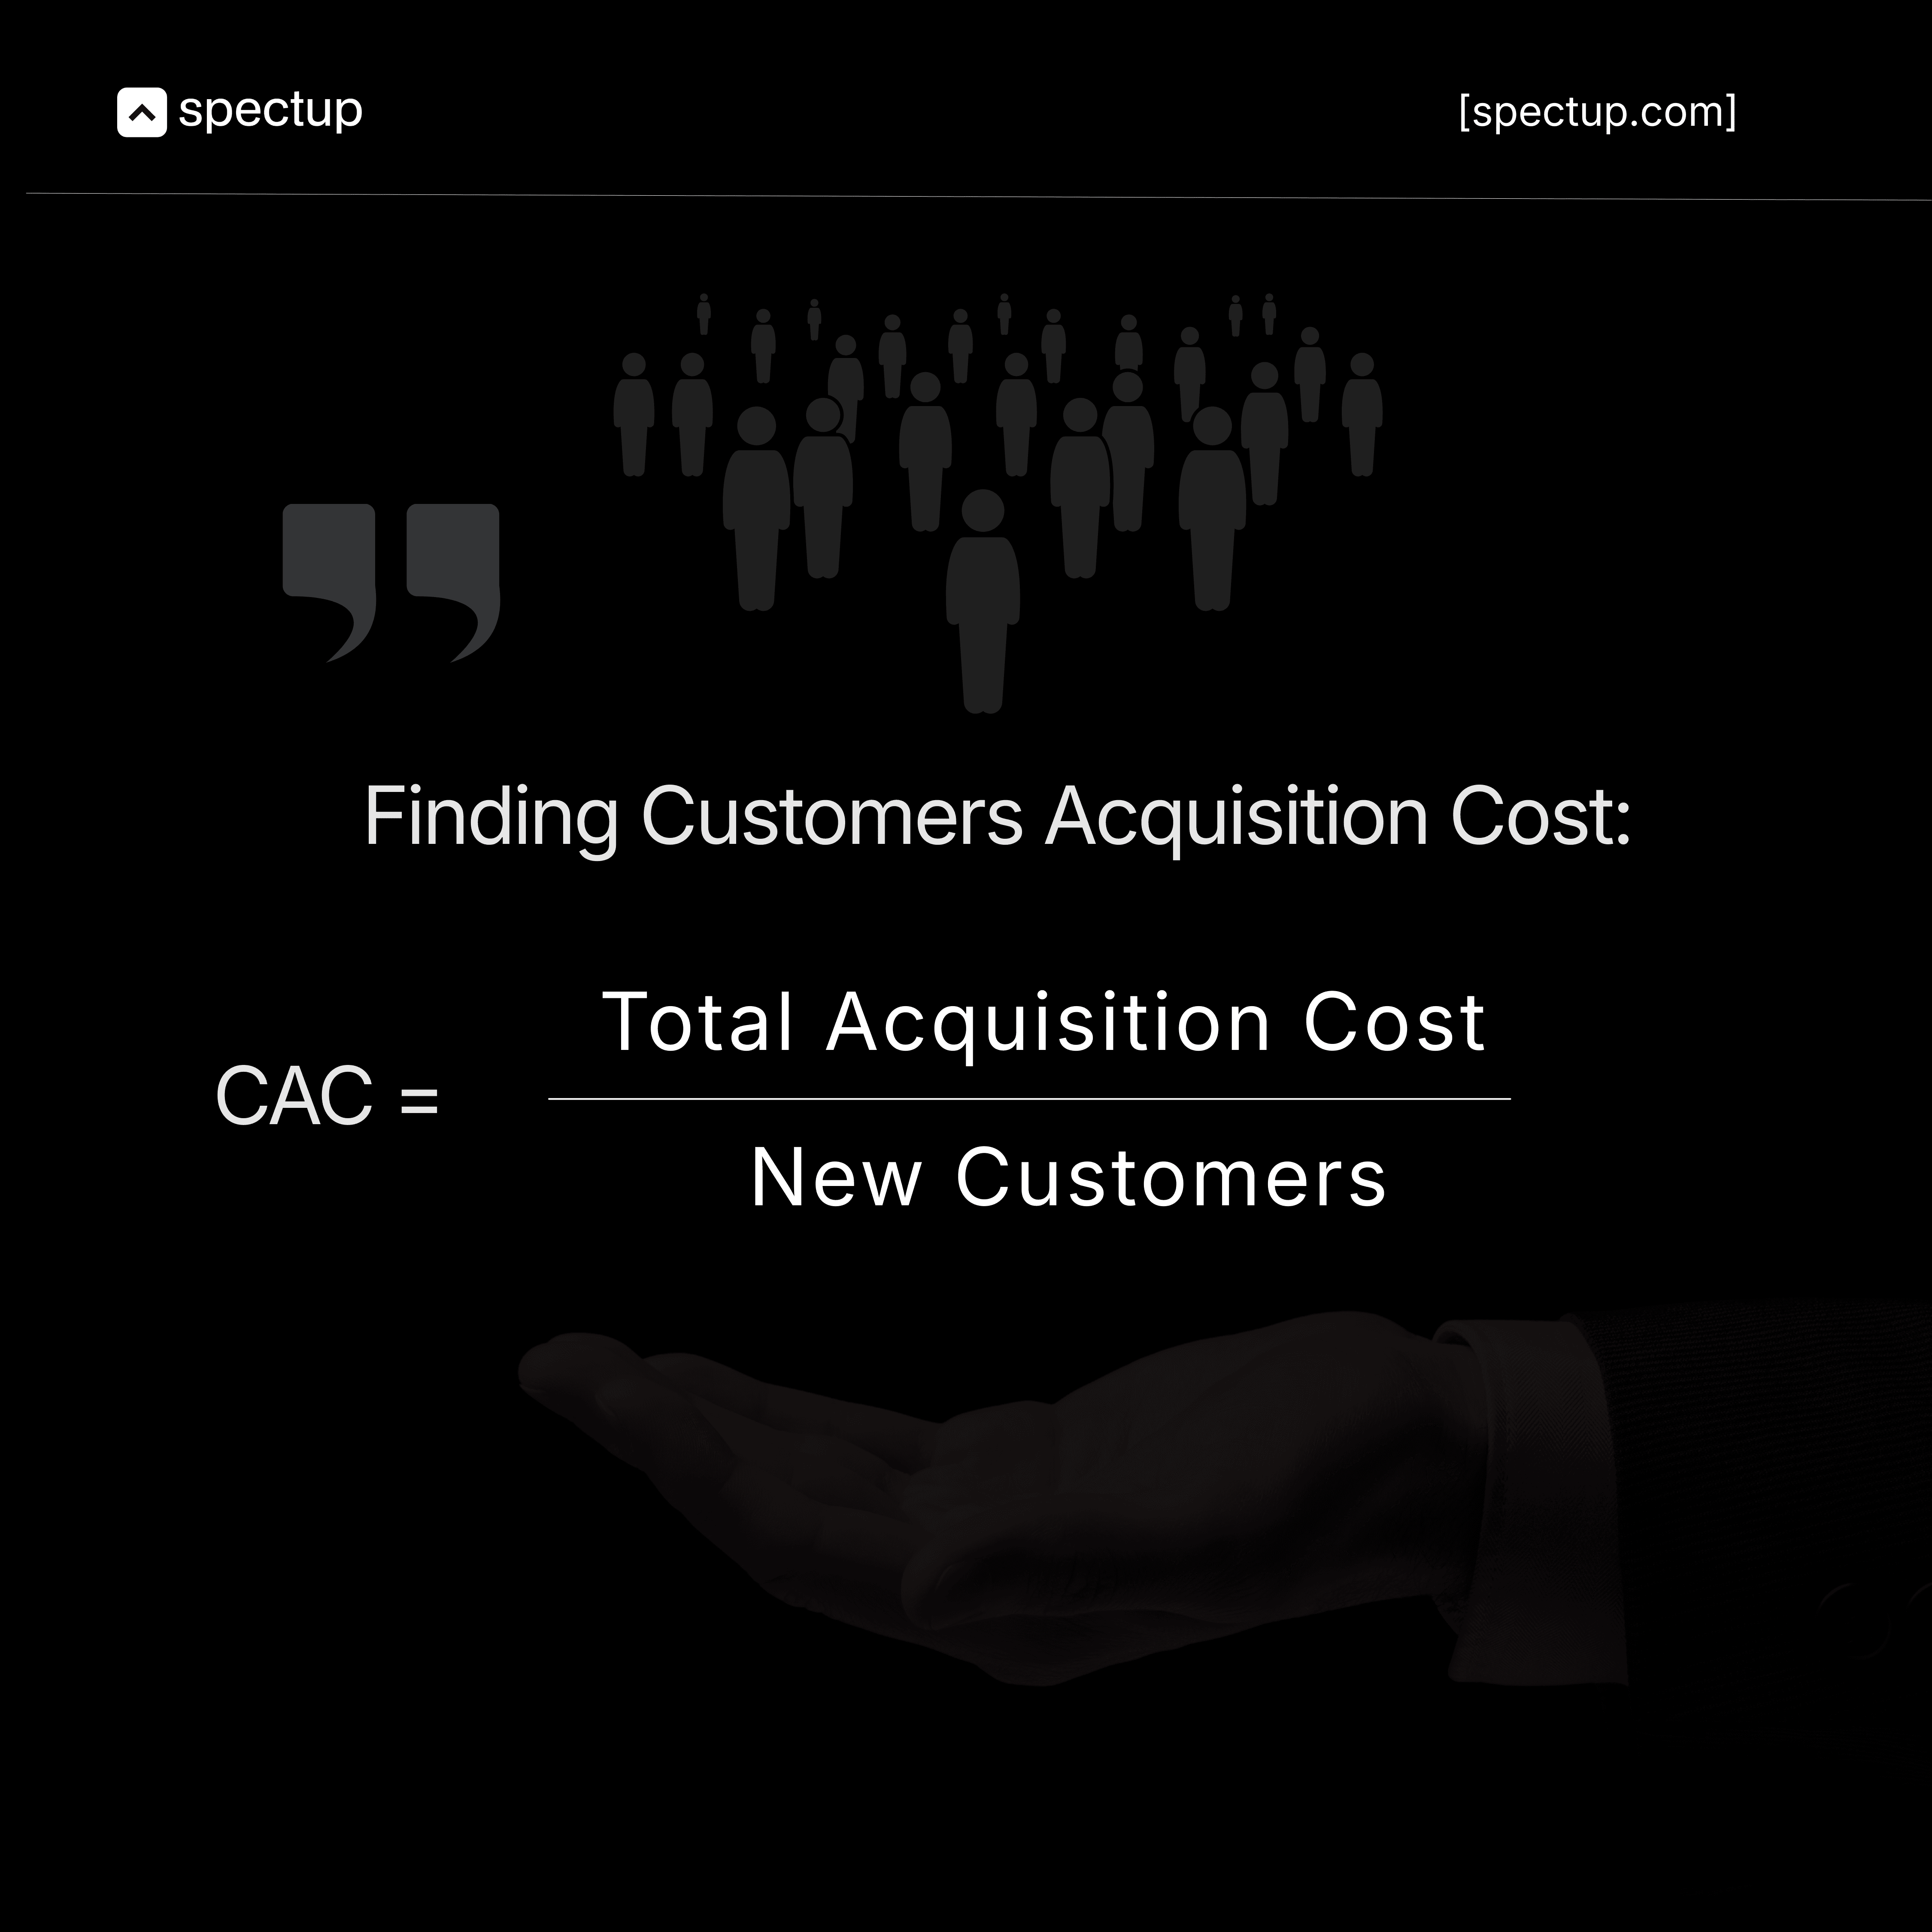
If you spend $12,000 to acquire a customer paying $1,000/month, your payback period is 12 months. Investors want to see this under a year, ideally much shorter.
A short payback period means you can reinvest revenue quickly to fuel more growth. Think of it as how fast your car can refuel and get back on the road.
The faster you recover acquisition costs, the less outside capital you need to scale.
Importance of Channel Breakdown
Don't just show an average.
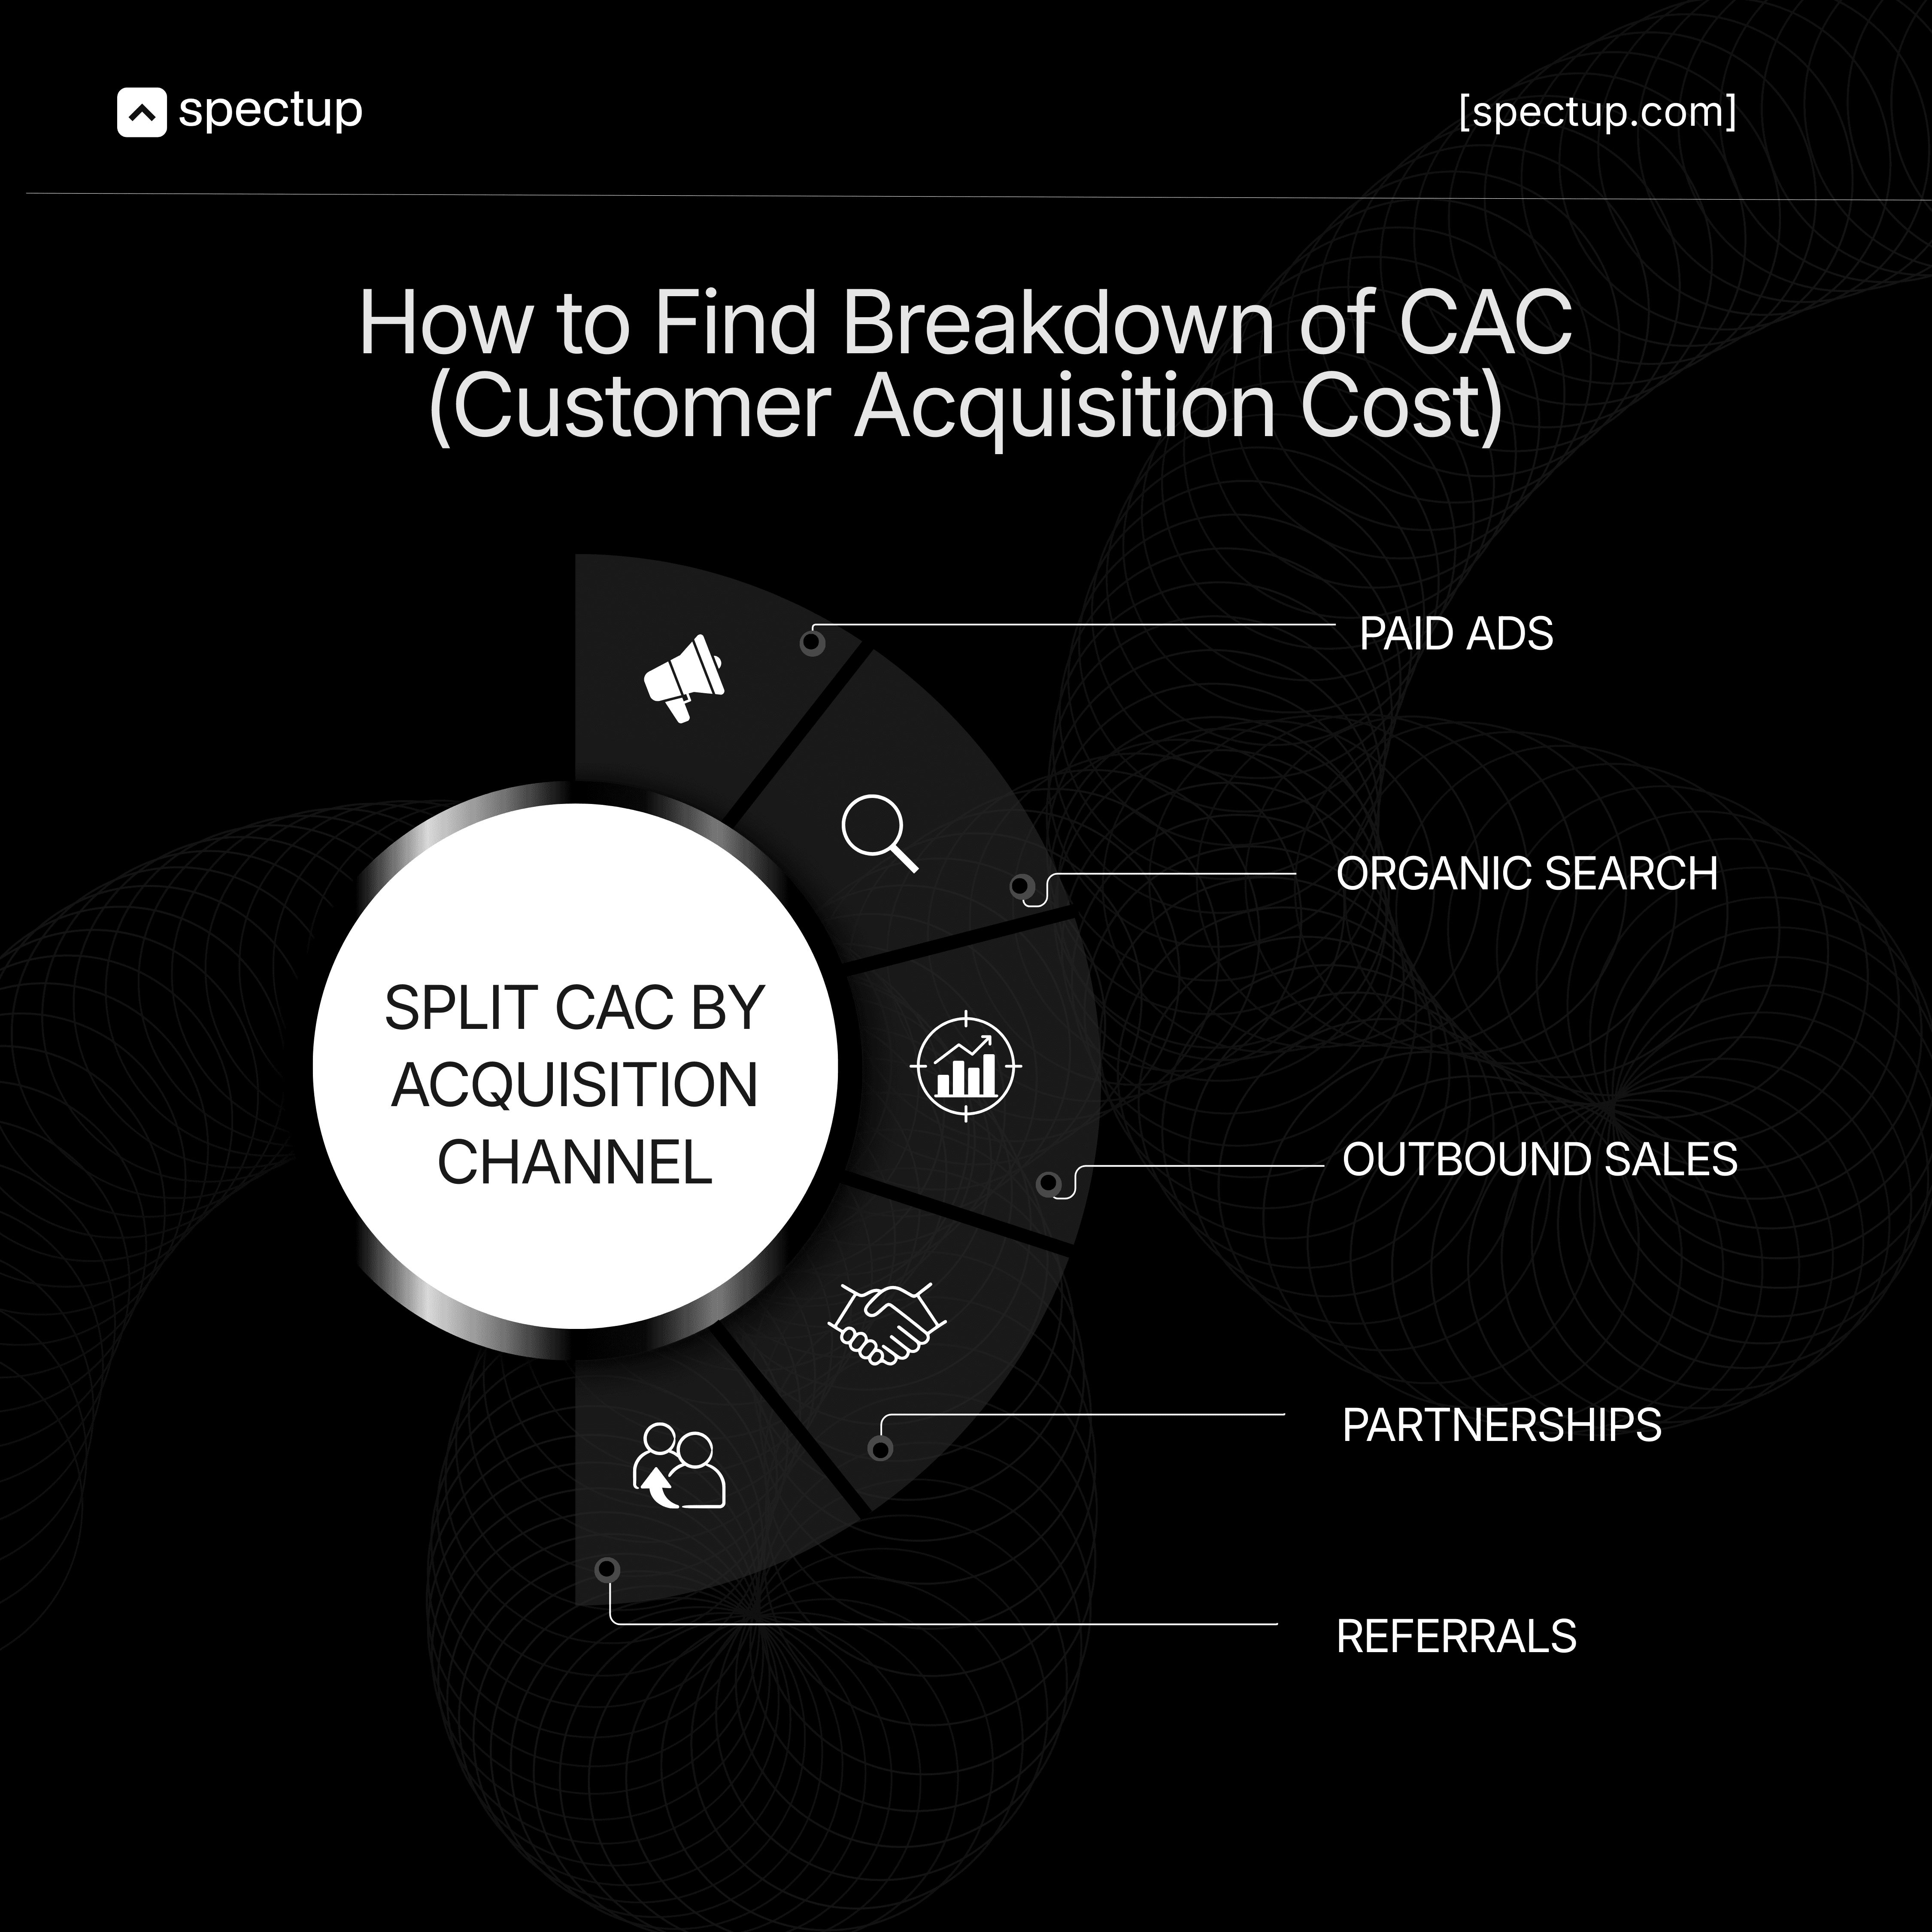
This reveals which engines are efficient and which are gas guzzlers. If paid acquisition has a 6-month payback while outbound takes 18 months, that tells you exactly where to double down.
Track the trend as you evolve your GTM
As a thumb rule for every startup, your CAC shouldn't be static. As you adjust pricing, target new segments, or experiment with marketing tactics, monitor how payback changes.
Are you moving upmarket and seeing CAC spike temporarily but with better long-term value?
Are you optimizing ads and cutting payback in half?
The story of how your CAC is trending matters as much as the number itself.
Investors want to see you're testing, learning, and getting smarter about acquisition.
LTV and LTV:CAC Ratio - Is the Trip Worth the Gas Money?
The benchmark: Greater than 3:1
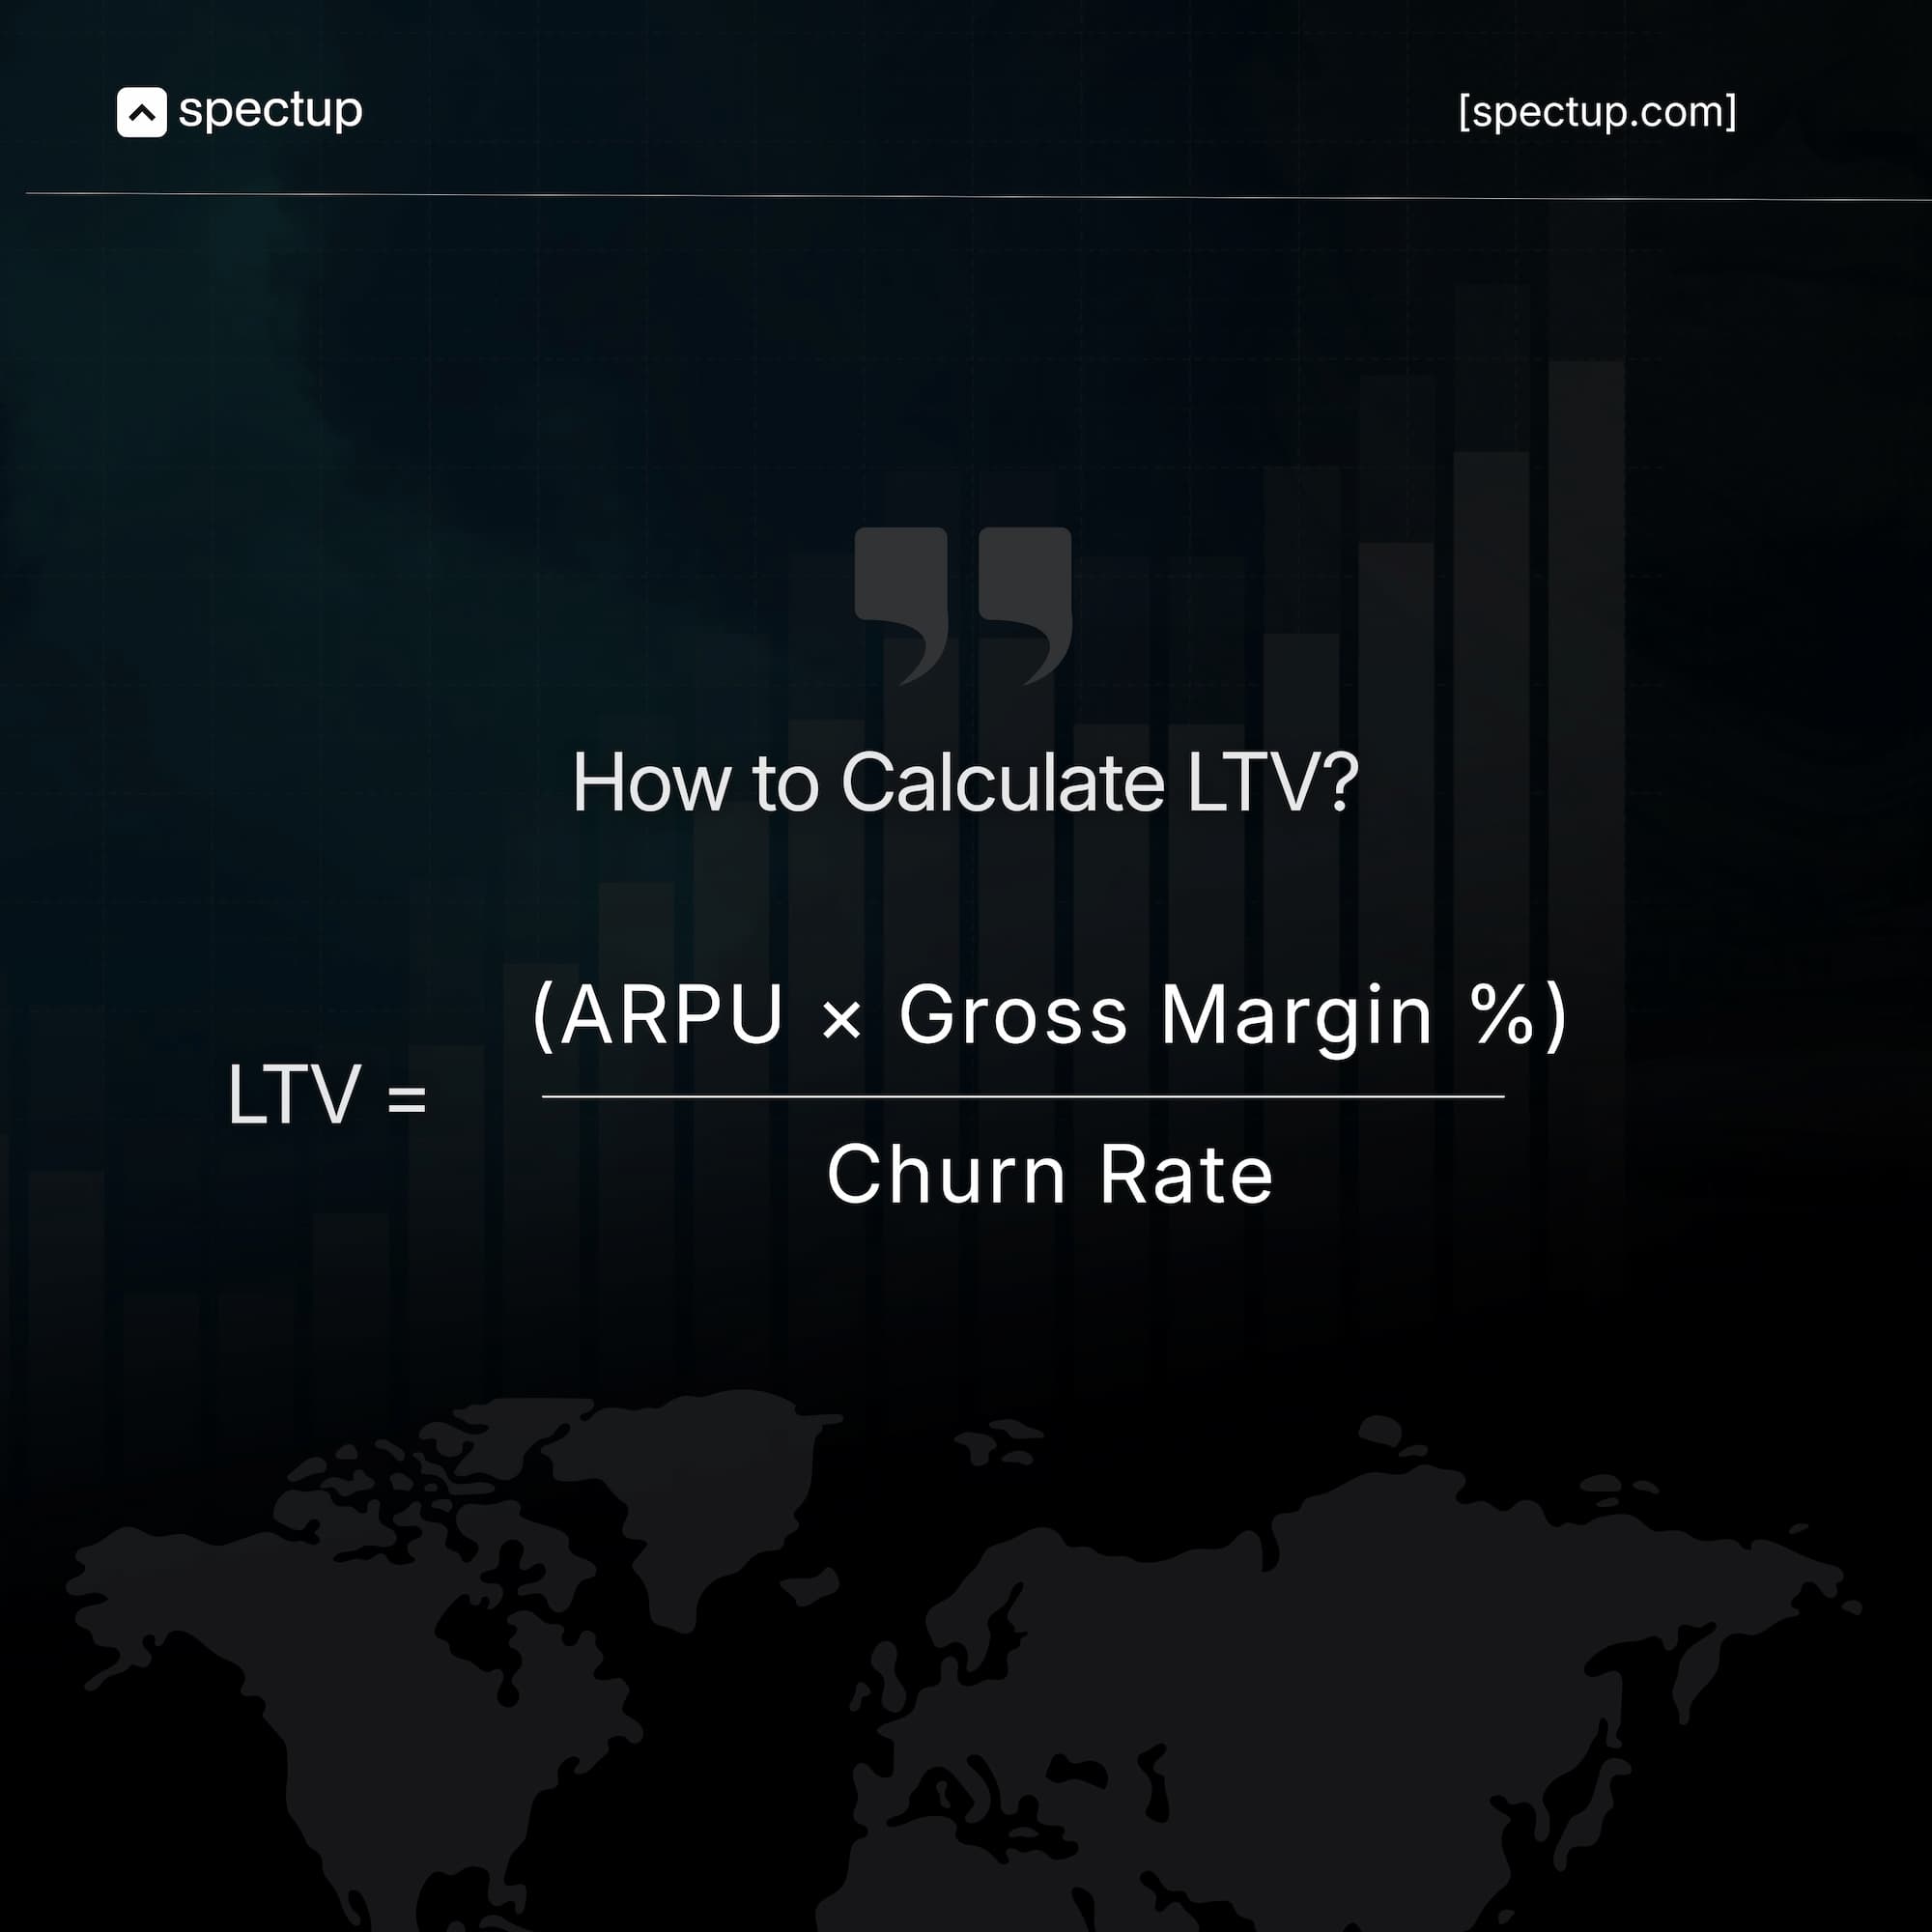
Customer Lifetime Value (LTV) tells you how much revenue a customer generates over their entire relationship with your company. The LTV:CAC ratio compares that lifetime value against what you spent to acquire them.
A healthy ratio is 3:1 or better, meaning for every dollar you spend acquiring a customer, you earn back at least three dollars.
This ratio answers a fundamental question investors ask: "Is this business model profitable at scale?"
If your LTV:CAC is 2:1, you're barely covering costs.
If it's 1:1 or lower, you're essentially paying customers to use your product.
At 3:1 or above, you're proving that every acquisition dollar compounds into meaningful profit.
Think of it as the return on your road trip. If you spend $100 on gas to drive somewhere that earns you $150, that's a bad deal once you factor in wear and tear. But if that same $100 trip generates $300+, now you're building a sustainable engine for growth.
Base your startup LTV:CAC on real data:
The biggest mistake founders make with LTV is inflating it with overly optimistic assumptions.
Don't project five-year customer lifetimes when your product has only been live for 18 months.
Don't assume zero churn when you're seeing 5% monthly attrition.
Investors can smell inflated LTV from across the table. They've seen the pitch where founders claim customers will stick around for a decade based on... hope.
Use actual cohort data.
Show retention curves.
If your average customer lifetime is 24 months based on real behavior, use that.
The wishful thinking of next 60 days that this might work, doesn't stick in Series A.
What investors are really checking in Series A Traction Metrics?
When VCs look at your LTV:CAC ratio, they're stress-testing your unit economics.
Can this business survive without constant capital infusions?
Does the math work when you scale to hundreds or thousands of customers?
Will you still be profitable if churn ticks up or acquisition costs rise?
A strong LTV:CAC ratio, backed by solid data, tells them: yes. This car runs efficiently, the trip is profitable, and you understand exactly how far each tank of gas will take you.
Sales Cycle Length: How Quickly Can You Close the Deal?
What to track: Average time from first contact to closed deal
Your sales cycle length measures how long it takes to convert a prospect into a paying customer. Long, drawn-out sales processes tie up resources, slow growth, and drain cash. Investors want to see you're closing deals efficiently. If you are getting stuck back and forth, you have already lost the batter.
Break down your Sales Cycle Length to reveal the real story
Showing average might have worked in pre-seed or in winning grants, but the case is not same now. Segment your sales cycle by:
Channel: Inbound leads often close faster than cold outbound
Customer type: Enterprise deals naturally take longer than SMB sales
This breakdown shows investors where your engine runs smoothly and where friction slows you down. If inbound leads close in 30 days while outbound takes 90, that tells VCs exactly which acquisition channels are most efficient.
Show in your Series A Metrics how you're accelerating with a Systemic Sales Cycle:
Have you introduced self-serve onboarding?
Built a product-led growth motion?
Streamlined your sales process with better qualification or automated demos?
These are some improvements that carry huge weigh. Shortening your sales cycle proves you're learning, iterating, and removing bottlenecks.
Faster sales cycles mean faster revenue recognition and healthier cash flow. Every week you shave off your average deal time compounds into months of additional runway. It's the difference between a car that gets you to your destination quickly versus one that crawls along in traffic burning fuel.
Pipeline Coverage & Forecast Accuracy: Can You Predict Where You're Headed?
The benchmarks: 3-4× pipeline coverage per rep | Forecast accuracy within 10-15%
At Series A, VCs expect you to have a firm grip on your sales pipeline and the ability to forecast revenue with confidence. This separates founders who truly understand their business from those running on hope.
Pipeline coverage per sales rep
A healthy pipeline has 3 to 4× coverage per rep.
If a rep's quarterly quota is $100K, they should have $300K to $400K in potential deals actively moving through the pipeline.
This buffer accounts for inevitable slippage deals that stall, prospects that ghost, contracts that push to next quarter.
Low coverage means you're one or two lost deals away from missing your numbers. Strong coverage proves you have enough fuel in the tank to hit targets even when some deals fall through.
Forecast accuracy in Sales tells the truth about your process
Show how your forecasts have tracked against actual results over the past 2-3 quarters.
If you projected $200K in Q1 and closed $195K, that's tight execution.
If you projected $200K and closed $120K, that's a problem.
Accurate forecasting doesn't mean you always hit exactly what you predict. It means you understand your conversion rates, deal velocity, and pipeline health well enough to make reliable projections. This proves your sales process is repeatable.
Pipeline sources matter
Break down where pipeline comes from: outbound prospecting versus inbound leads. This reveals how scalable your growth is.
If 80% of pipeline comes from manual outreach by your founding team, that's a red flag and it clearly shows, it won't scale.
If inbound drives half your pipeline, that shows brand momentum and efficiency.
Now, many startups struggle in this. Least they know, strong pipeline management and forecast accuracy signal operational maturity. At this stage, Investors are buying your ability to reliably hit future milestones. If you can't predict where you'll be in 90 days, how can they trust your three-year projections?
It's the difference between a driver who knows exactly how far they can go on a tank of gas versus one who's hoping they don't run out before the next station.
Series A Traction Isn’t Just a Revenue.
Series A Traction goes beyond revenue numbers. Every single traction metric of series A tells a story and a startup fundamental that this could work in real-time. That is why, in the competitive market, by focusing on right Series A Traction Metrics, you showcase your potential for future growth.

Niclas Schlopsna
Partner
Ex-banker, drove scale at N26, launched new ventures at Deloitte, and built from scratch across three startup ecosystems.


