When most founders think about investor metrics and startup KPIs, they obsess over one number: revenue. It's the big, shiny headline. The number you drop at networking events. The metric that makes you feel like you're actually building something.
And look, revenue matters. spectup will be guiding you right, it's a critical indicator that your startup can actually generate cash instead of just burning through it. But here's the thing most founders miss until they're sitting across from a Series A investor who's unimpressed by their growth chart:
Revenue is just one piece of a much bigger, more complicated puzzle.
Major investors, specifically those writing checks, don't get excited by impressive headlines alone.
They've seen too many startups with hockey-stick revenue that collapsed six months later because:
The unit economics were garbage
Churn was through the roof
Or the business model only worked if you kept lighting money on fire.
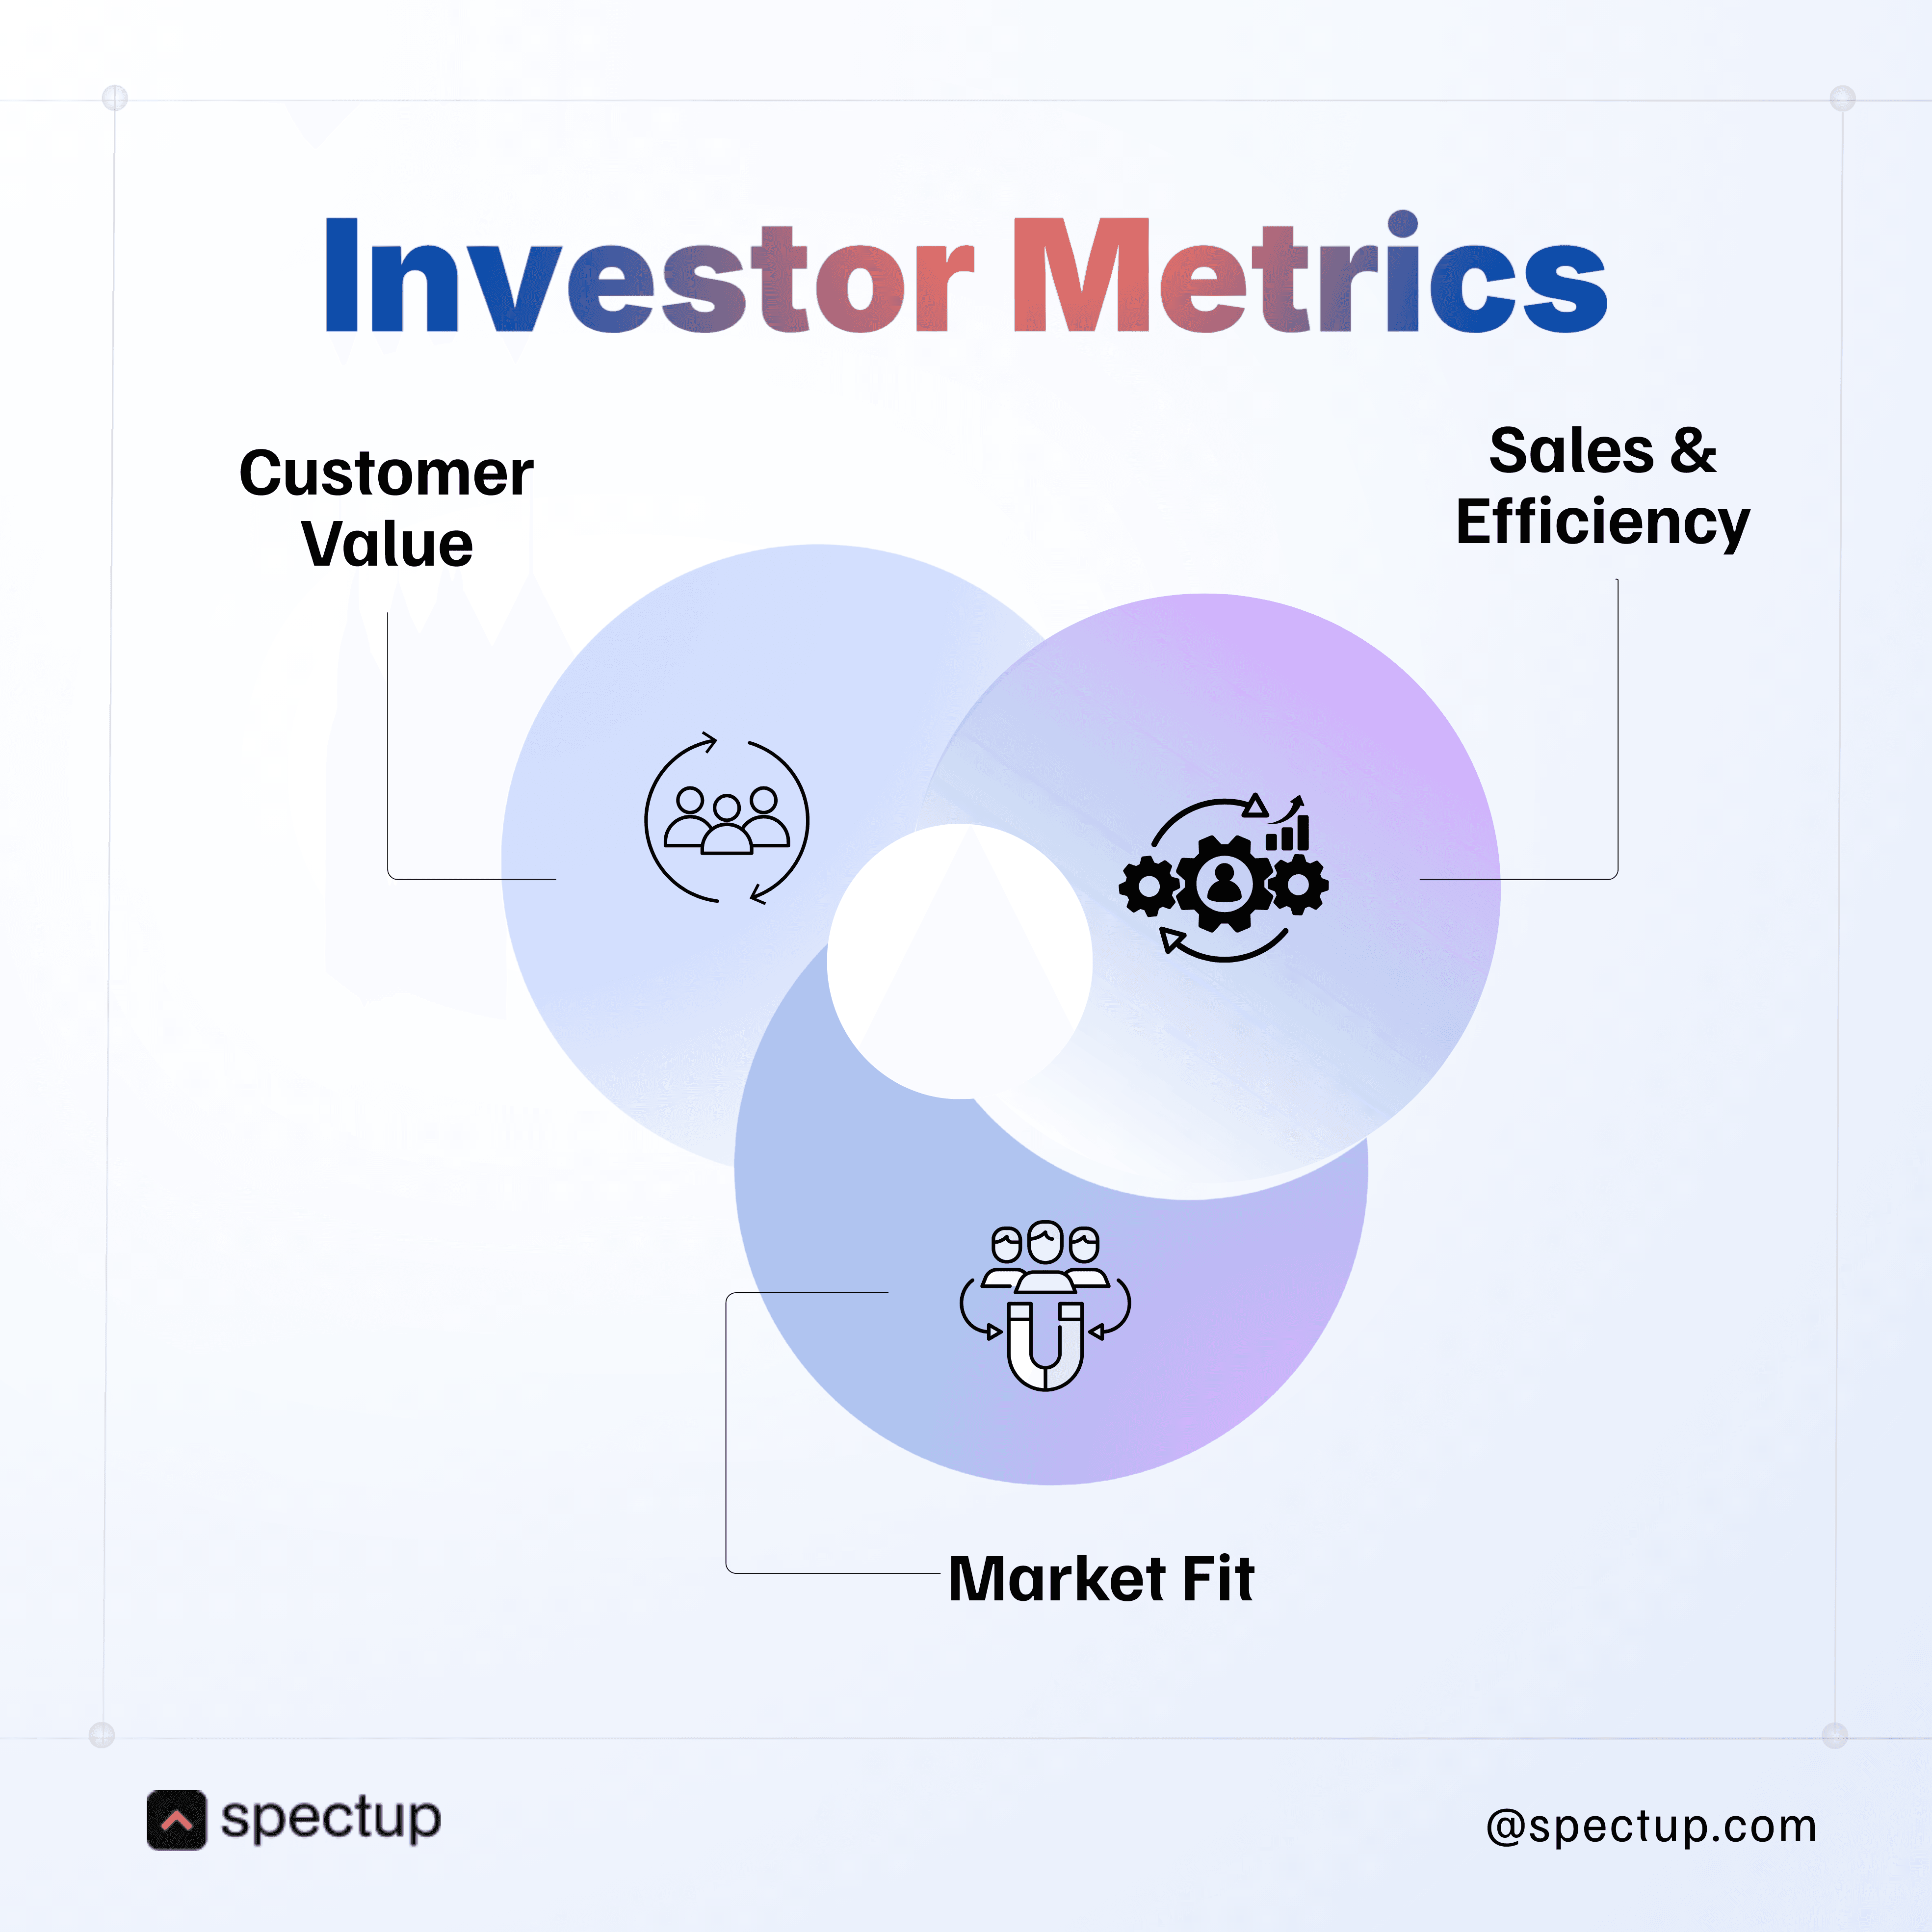
What Investor Metrics are Big Shots for startups?
A comprehensive assessment of your overall performance.
They dive beneath the surface, analyzing the metrics that reveal:
Whether your startup can scale
Whether customers actually stick around
Whether your operations are efficient or just held together with duct tape and hope
Most importantly, whether this thing has any shot at long-term sustainability.
These deeper metrics for investors, things like LTV:CAC ratios, net revenue retention, gross margins, burn multiple, give a richer, more complete picture of your business's potential and resilience than raw revenue ever could. Understanding what these metrics actually mean and why investors care about them empowers you to make smarter decisions, spot problems before they become catastrophic, and chart a clearer path toward sustainable growth instead of just impressive-looking vanity metrics.
This broader approach to investor evaluation criteria doesn't just help you raise capital, it drives better outcomes, Period Because the metrics investors care about? They're the same ones that determine whether your startup actually survives.
So, if you are still here reading, Let's dive into
What are the Right Investor metrics that Growth-Staged Startups must Own.
No two startups are exactly alike, each operates within a different industry, stage, and market environment. Your strategic goals, customer segments, and even the speed at which you plan to scale will influence which metrics matter most. That’s why choosing the right Key Performance Indicators (KPIs) is about identifying the data that truly reflects your progress and potential.
Tailoring Metrics to Your Stage:
Startups move through distinct growth phases, each with its own priorities:
Early Stage:
Focus on metrics like:
Customer acquisition cost (CAC)
User engagement
Product-market fit.
These help you understand if your solution is resonating with early adopters.
Growth Stage:
Shift attention to:
Monthly recurring revenue (MRR)
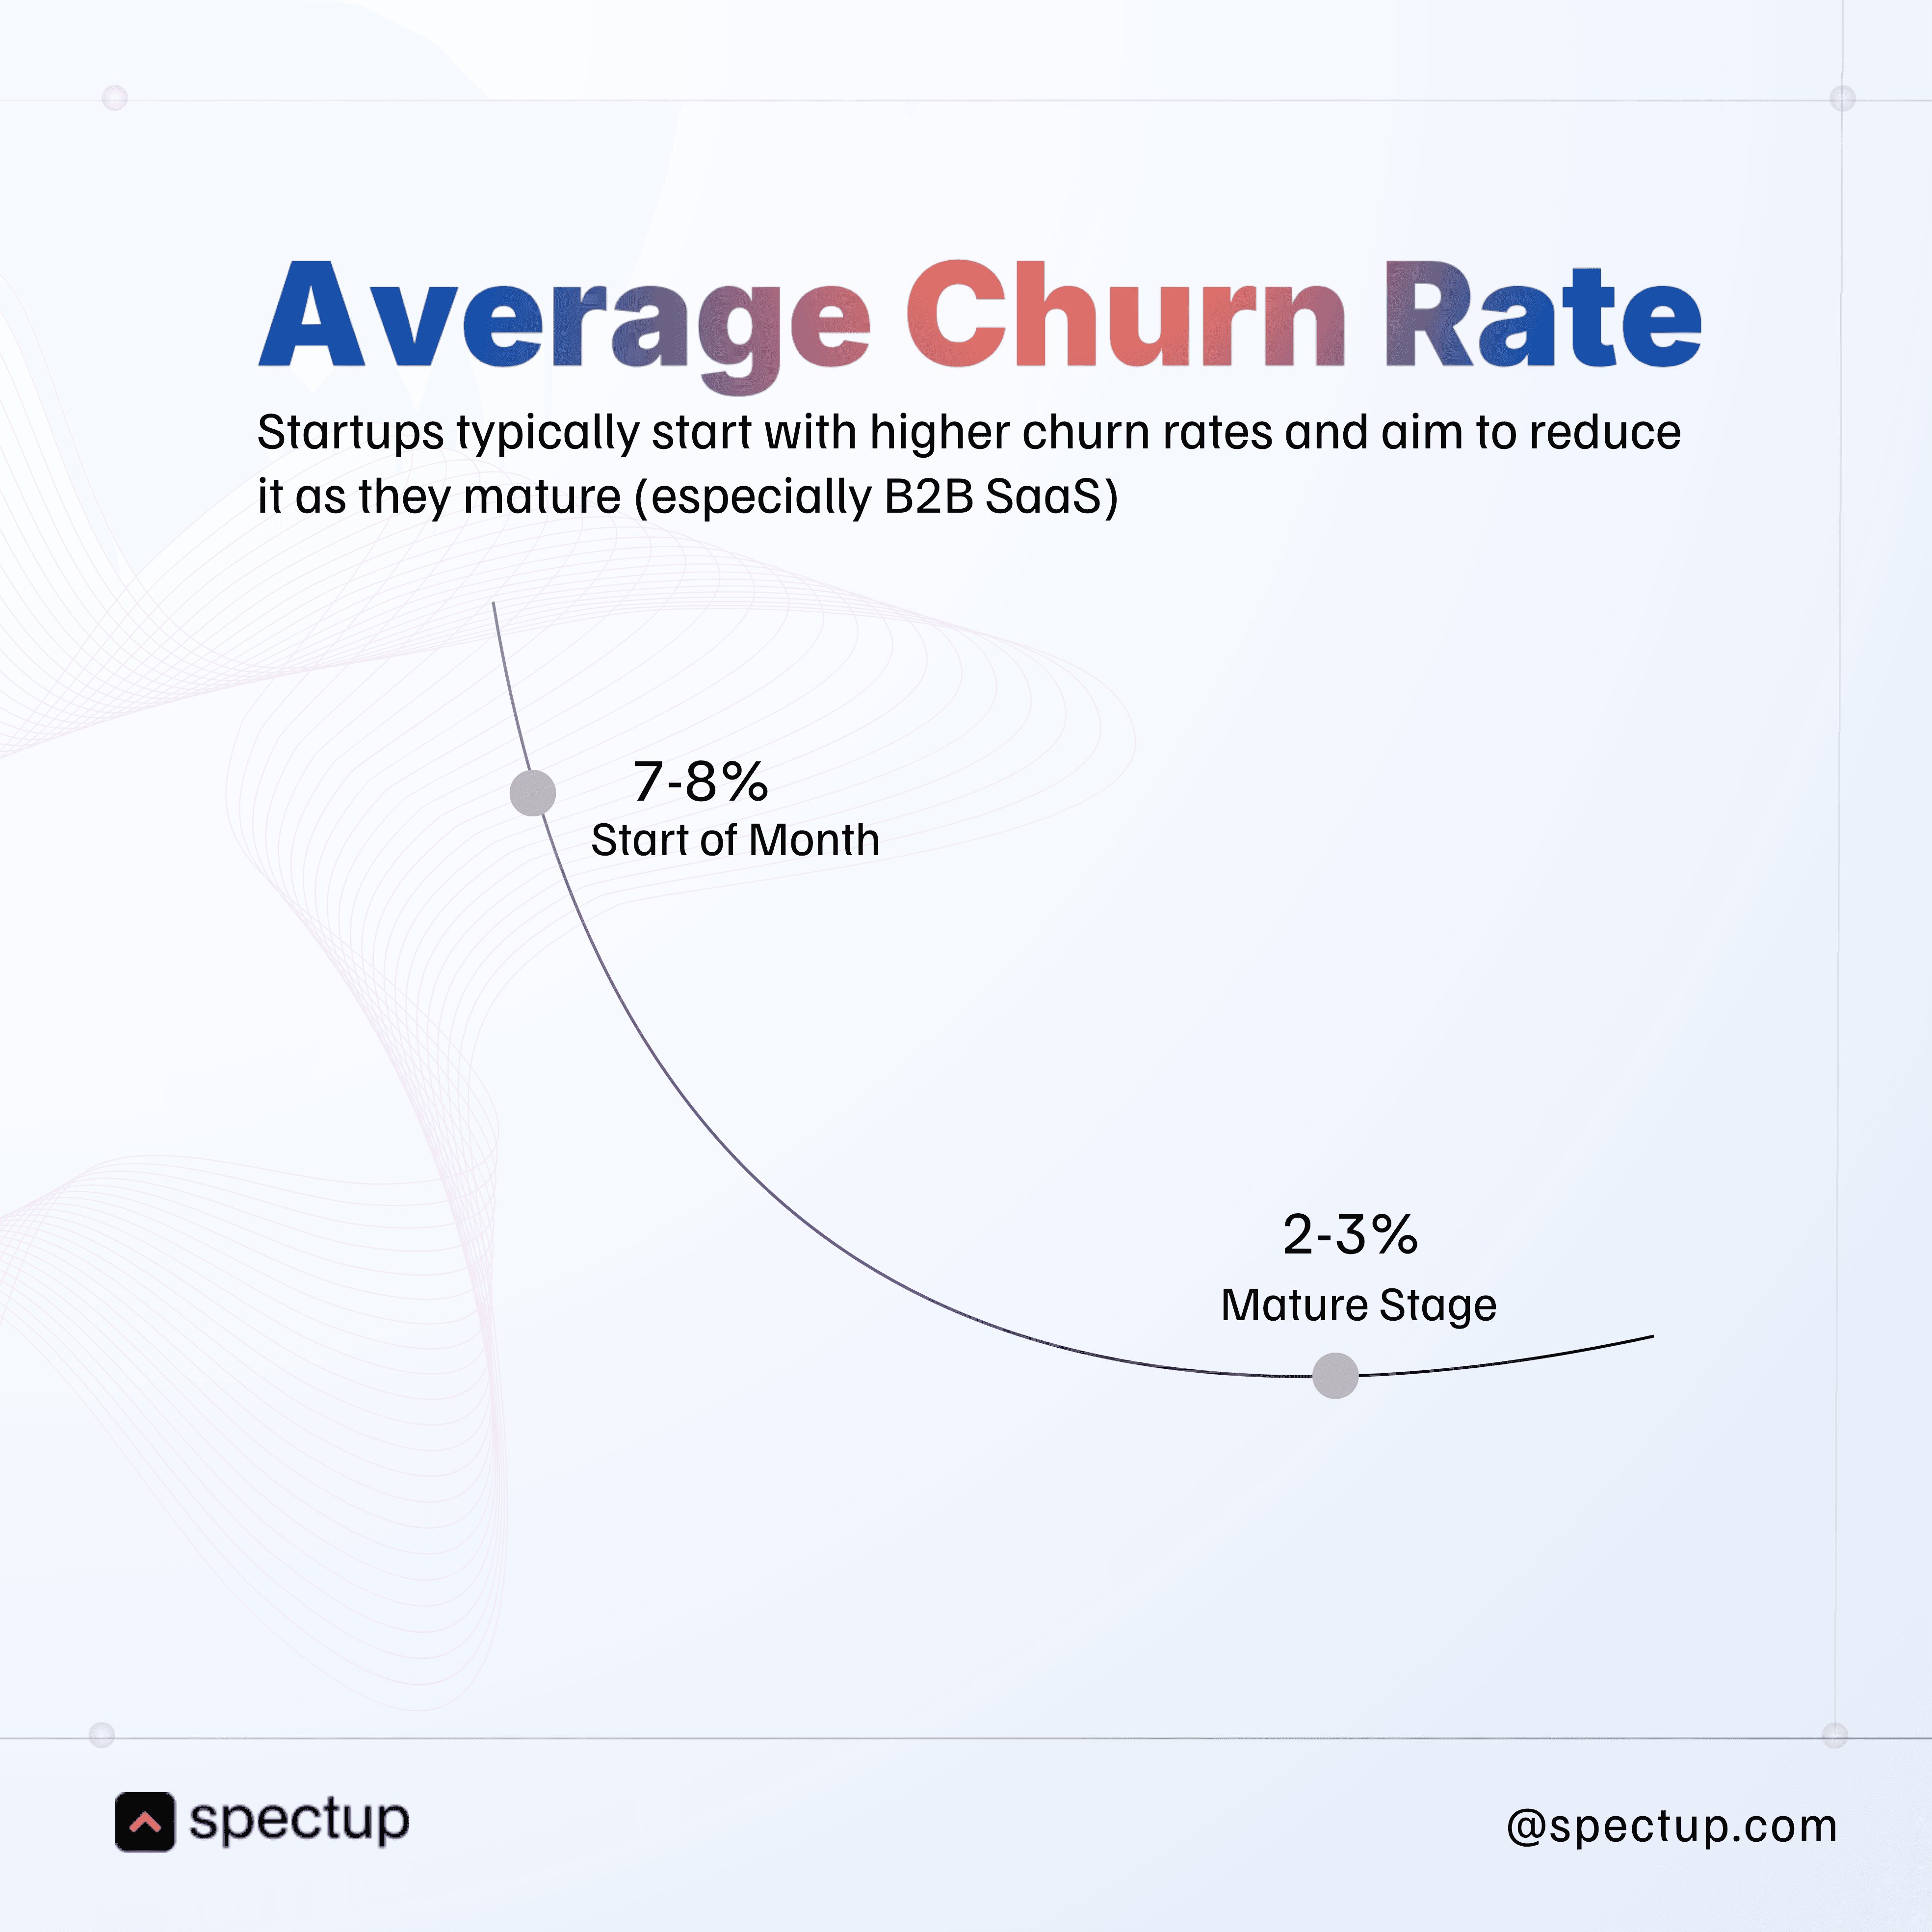
Churn rate
Lifetime value (LTV).
Investors want to see traction and signs of repeatable growth.
Expansion or Scale-Up:
Emphasize:
Gross margins
Unit economics
Operational efficiency.
These show how well your business model performs as you scale.
By mapping KPIs to your current objectives, you’re better positioned to allocate resources efficiently, whether it’s doubling down on sales channels or improving product retention.
“What gets measured gets managed.” This classic insight rings especially true for startups seeking clarity in decision-making.
Now, if you still here, unhinged to find out why these Investor Metrics create a big Hotshot opportunity for growth-staged founders and toraise capital faster, stick around.
Why a Multi-Metric Approach Matters
By combining several key indicators, investors can:
Uncover underlying trends that raw revenue figures may hide
Assess how efficiently your startup converts investment into growth
Identify potential risks such as over-reliance on a single client or unsustainable marketing spend
When you communicate these metrics clearly and tie them back to your unique growth story, you not only build investor confidence but also empower yourself to steer the business more effectively.
When it comes to Investor metrics and startup KPIs, Revenue is the star of the show.
It's the flashy number everyone name-drops at Demo Day. The metric that makes your parents finally understand what you've been building in your garage for two years.
And yeah, who doesn't want to see growing sales?
But most founders learn the hard way: revenue can be a false positive.
Let's imagine, you're generating substantial sales, your top-line growth looks incredible, and you're feeling pretty good about yourself. But dig one layer deeper and the story falls apart. Those revenues?
They're coming from one-time transactions that'll never repeat.
Or they're propped up by discounts so steep you're basically paying customers to use your product.
Or worse, you're spending $5 in CAC to acquire $3 in LTV, which is just a fancy way of saying you're bleeding out.
Impressive revenue. Terrible business.
This is exactly why investors dive way deeper than just top-line figures. They've been burned too many times by startups with gorgeous growth charts and catastrophic unit economics hiding underneath.

What Investors Actually Evaluate:
Scalability:
Can your business model grow without costs skyrocketing in lockstep?
If you need to hire 10 new support reps for every 100 customers, you don't have a scalable business, you have an expensive services company pretending to be a startup.
Efficiency:
Are you converting resources, time, capital, headcount, into revenue effectively?
Or are you just throwing bodies and budget at problems until something sticks?
Long-term profitability:
Will your startup actually sustain healthy profit margins over time
Or are you one market shift away from underwater unit economics.
And here is something most founders overlook: as you're wrestling with these metrics, think about building advisory teams that can actually help you navigate this maze. The right advisors, people who've been through multiple funding rounds, who understand what investors actually care about versus what they say they care about, can save you months of trial and error.
Startup mentorship isn't just about warm introductions (though those help).
It's about having someone in your corner who can look at your metrics and tell you the hard truth: "Your revenue looks great, but your unit economics are going to kill this raise." That kind of guidance ensures you're not just chasing vanity metrics but building something that can actually sustain growth.
Revenue is only one piece of a complex puzzle investors are solving when they decide where to put their money. Understanding this broader lens helps you focus on what really drives value in investor evaluation, and keeps you from falling into the trap of relying solely on headline numbers that look impressive in a pitch deck but crumble under due diligence.
Customer Lifetime Value (CLTV): The Metric That Separates Real Businesses from Hype
When investors dig into your startup KPIs, one metric makes them sit up and pay attention: Customer Lifetime Value, or CLTV (sometimes LTV, depending on who you ask).
How much money you're making today is definitely helpful. But, how valuable each customer will be over time. And that distinction? That's everything.
CLTV tells investors whether your customers are one-and-done transactions or long-term relationships that keep paying dividends quarter after quarter. It reveals whether:
You're building a sustainable business
Just riding a temporary wave that'll crash the second you stop spending on acquisition.
This is a crucial factor among investor metrics, and while dealing with investor outreach, we have seen this in real-time.
Working with a SaaS startup, analyzing their CLTV revealed untapped growth opportunities they'd completely overlooked. It reshaped their entire fundraising strategy and helped them tell a story investors actually wanted to hear.
What Investors Actually Look For:
High LTV relative to CAC:
If it costs you $50 to acquire a customer (Customer Acquisition Cost), but that customer only spends $40 over their lifetime, alarm bells don't just ring, they scream.
Investors want to see a healthy ratio here. Ideally, your LTV should be at least 3x your CAC. Anything less, and you're essentially paying customers to use your product. Not a great look when you're asking for millions in funding.
Increasing LTV over time:
Growth in LTV signals that customers are finding
Ongoing value in your product
Sticking around longer
Spending more.
All signs of a business that actually works instead of one held together by aggressive discounting and prayer.
This is especially important when you're building advisory teams or seeking startup mentorship. A high, growing LTV indicates a sustainable business model that attracts quality advisors who want to be associated with winners, not projects.
How to Calculate CLTV (Because Investors Expect You to Know This)
Here's the formula investors will ask you about in the first five minutes of due diligence:
CLTV = (Average Purchase Value) × (Purchase Frequency) × (Customer Lifespan)
Breaking it down:
Average Purchase Value: How much a customer spends each time they transact
Purchase Frequency: How often they buy or renew
Customer Lifespan: How long they stay active before churning
Simple math. Massive implications.
Investors' Perspective: Why They Care So Much?
CLTV tells the story beyond raw revenue. A startup with consistent repeat customers who spend more over time looks infinitely more promising than one with big sales spikes but zero returning buyers.
One is a business. The other is a marketing campaign pretending to be a business.
Real Examples of CLTV in Action
We worked with a SaaS company:
Charging $20/month.
On average, users stayed subscribed for 2 years. That meant each customer was worth $480 over their lifetime, a number that suddenly made their growth potential tangible and compelling to investors.
Before they understood CLTV, they were just talking about MRR growth. After? They had a narrative about sustainable, compounding revenue that investors could actually model out.
On the flip side, we've seen e-commerce brands.
Where a customer might spend $100 per purchase, shop 3 times a year, and stick around for 5 years. That's $1,500 per customer. Suddenly, spending $200 on acquisition doesn't look crazy, it looks strategic.
Understanding CLTV like this doesn't just help with projections.
It shapes your entire strategy: how much you can afford to spend on acquisition, which customer segments to prioritize, how to structure your fundraising story, and what your long-term business actually looks like.
Both examples highlight the same truth:
Understanding these numbers helps you attract savvy investors by proving your future revenue streams are strong, predictable, and reliable.
Customer Retention and Churn Rates in Investor Metrics:
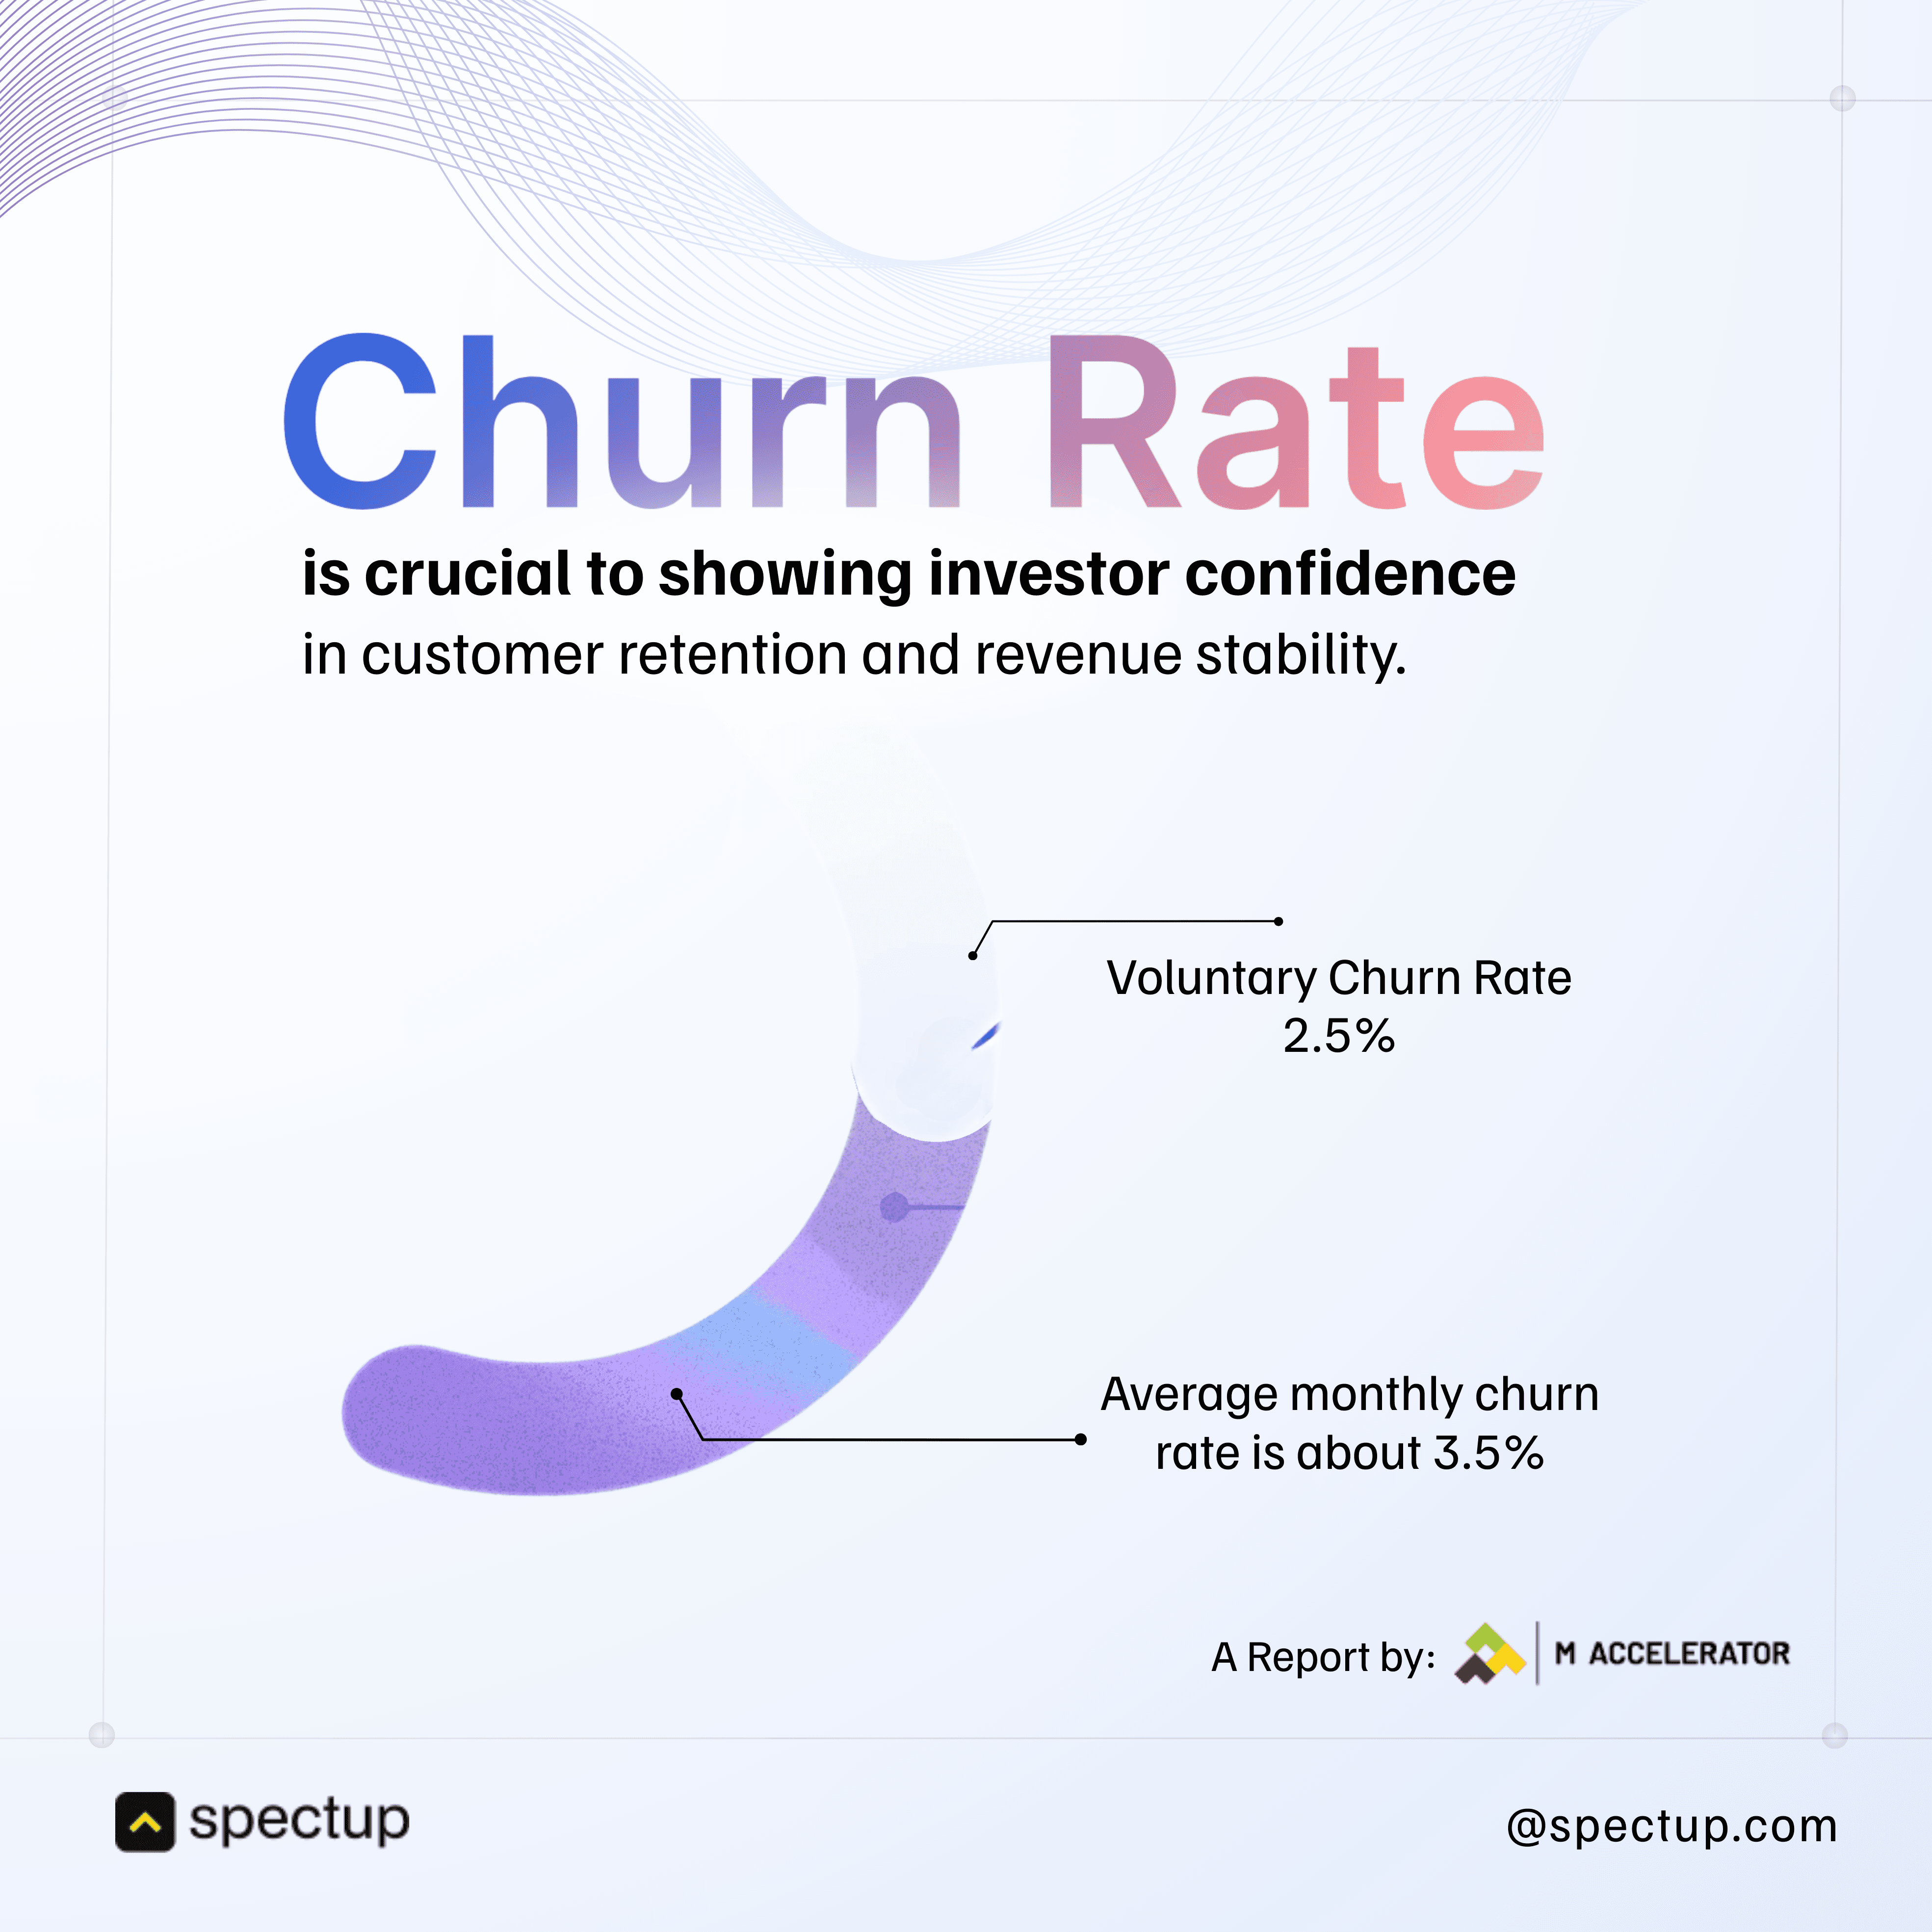
When investors analyze startup KPIs, they look beyond just impressive revenue figures. Retention and churn rates provide valuable insights into how effectively a business retains its customers, and this information is crucial for understanding key investor metrics.
You can think of retention rate as the percentage of customers who stick around and continue using your product, while churn rate is the number of customers who decide to leave.

Evidence of this can be seen in a previous project involving a startup client, CreatorIQ. By diving deep into their retention and churn data, different patterns were identified that were invisible at first glance. With targeted strategies, these not only improved customer stickiness but also presented a stronger growth story to investors, showing that the team doesn’t just analyze numbers, but also help turn them into actionable insights that drive funding decisions.
Investors would love to have a look on Metrics and Numbers that scream:
Retention Rate: A high retention rate means your product or service keeps customers happy and engaged.
Churn Rate: Lower churn indicates fewer customers leaving, which boosts confidence in future revenue stability.
Net Revenue Retention (NRR): This metric accounts for revenue lost from churn but also gains from upsells or expansions within existing customers. NRR above 100%? That is the evidence compelling investors to consider the startup.
Reducing churn and improving retention, more like a strategy in action.
Here are some proven tactics:
Building Advisory Teams: Dedicated customer success teams proactively help customers get the most value, reducing frustration and boosting loyalty.
Onboarding Process: A smooth, helpful onboarding experience sets the tone for long-term satisfaction.
Personalization and Engagement: Tailoring interactions based on customer behavior makes users feel seen and valued, increasing their likelihood to stay.

Customer Acquisition Cost (CAC): The Number That Makes or Breaks Your Raise
When investors dig into your startup's financial health, one metric matters more than almost anything else: Customer Acquisition Cost (CAC).
CAC measures exactly what it sounds like: How much it costs you to acquire a new customer.
Take your total marketing and sales spend, divide it by the number of customers you actually landed, and boom: that's your CAC.
Investors pay attention to the following factors when evaluating CAC:
Low CAC relative to LTV:
Investors want to see that acquiring customers isn’t burning through cash faster than those customers bring in revenue. A low CAC compared to Customer Lifetime Value (LTV) signals a sustainable business model.
Efficient use of resources:
Spending wisely matters. If you’re blowing your budget on expensive ads or pricey sales teams without results, that raises eyebrows.
Decreasing CAC over time:
Showing that you can get better at bringing in customers at a lower cost proves your startup is learning and scaling efficiently. Ideally, you'd want to aim for a CAC that falls within the average range for SaaS businesses, which would further validate your business model and operational efficiency.
How to Actually Lower CAC (Without Sacrificing Growth)
1. Double down on what works:
Stop spreading your budget across every marketing channel like peanut butter. Find the 1-2 channels delivering real results—whether that's SEO, partnerships, or a specific paid channel—and go all-in.
2. Automate the repetitive stuff:
Use tools for email campaigns, chatbots, lead scoring, whatever lets you scale outreach without scaling headcount.
Less manual labor = lower costs.
3. Fix your conversion rates:
Before spending another dollar on acquisition, make sure you're not leaking leads.
Tweak landing pages
Sharpen your messaging
Test CTAs.
Turn more visitors into customers without spending more.
Sales Efficiency: How Fast (and How Well) You're Closing Deals
When investors dig into your startup KPIs, they care a lot about sales efficiency. It's about how fast and how profitably you're actually closing them.
Two metrics tell this story: Sales Velocity and Close Rate. Master these, and you're speaking the language investors actually understand.
Sales Velocity: Your Revenue Speedometer
Think of sales velocity as the speedometer for your revenue engine. It tells investors how quickly money is moving through your sales pipeline.
Here's the formula:
Sales Velocity = (Number of Opportunities) × (Average Deal Size) × (Win Rate) ÷ (Sales Cycle Length)
Breaking it down:
Number of Opportunities: How many deals are in your pipeline right now?
Average Deal Size: What's each deal typically worth?
Win Rate: What percentage of opportunities actually close?
Sales Cycle Length: How long does it take to close a deal from first contact to signed contract?
Investors love startups with high sales velocity because it signals you're using resources efficiently and generating revenue fast. A short sales cycle plus a strong win rate? That screams product-market fit and a repeatable sales motion.
Close Rate: Are You Actually Converting?
Close rate is dead simple: the percentage of leads that turn into paying customers.
What investors look for:
Consistently high or improving close rates = strong sales execution
Growing close rate over time = better product-market fit or sharper sales strategies
Low close rates = alarm bells about lead quality or a broken sales process
Tracking these metrics proves to investors you're not just generating leads—you're converting them. And that's what separates real businesses from glorified lead-gen machines.
Gross Margin: The Profitability Reality Check
When investors evaluate your startup, gross margin is one of the first things they calculate. It shows how much money you're keeping after covering the direct costs of delivering your product or service.
High gross margins signal your business model is efficient and scalable, exactly what investors want to see.
What Investors Look For in High Gross Margin:
A strong margin means you can cover operating expenses and still turn a profit. Low margins? You're stuck in a race to the bottom where every sale barely moves the needle.
Margin Improvement Over Time:
Investors want proof you're getting better at this. Are you optimizing costs as you scale, or are your margins shrinking because you can't figure out unit economics?
How to Actually Improve Gross Margin:
Optimize production:
Streamline how you manufacture or deliver your service.
Lower direct costs without sacrificing quality. Easier said than done, but that's the game.
Increase pricing:
Seriously evaluate if your pricing reflects your actual value. A lot of founders underprice out of fear. Sometimes a modest price increase can boost margins significantly without losing customers.
Offer premium products:
Introduce higher-end tiers or add-ons. Customers willing to pay more will lift your overall profitability without requiring more operational complexity.
The Role of Engagement Metrics: Proving Users Actually Care
Working with hundreds of startups, here's what we've observed: investors don't just want to see your revenue grow, they want to know if customers actually care about what you're building.
Engagement metrics give them that window. They reveal:
Whether users find real value in your product
Or if your growth is just a temporary sugar rush fueled by discounts and hype.
These investor metrics are crucial for spotting startups that are growing and also building sustainable, loyal user bases that'll stick around when the honeymoon phase ends.
Key Startup KPIs Investors Actually Watch:
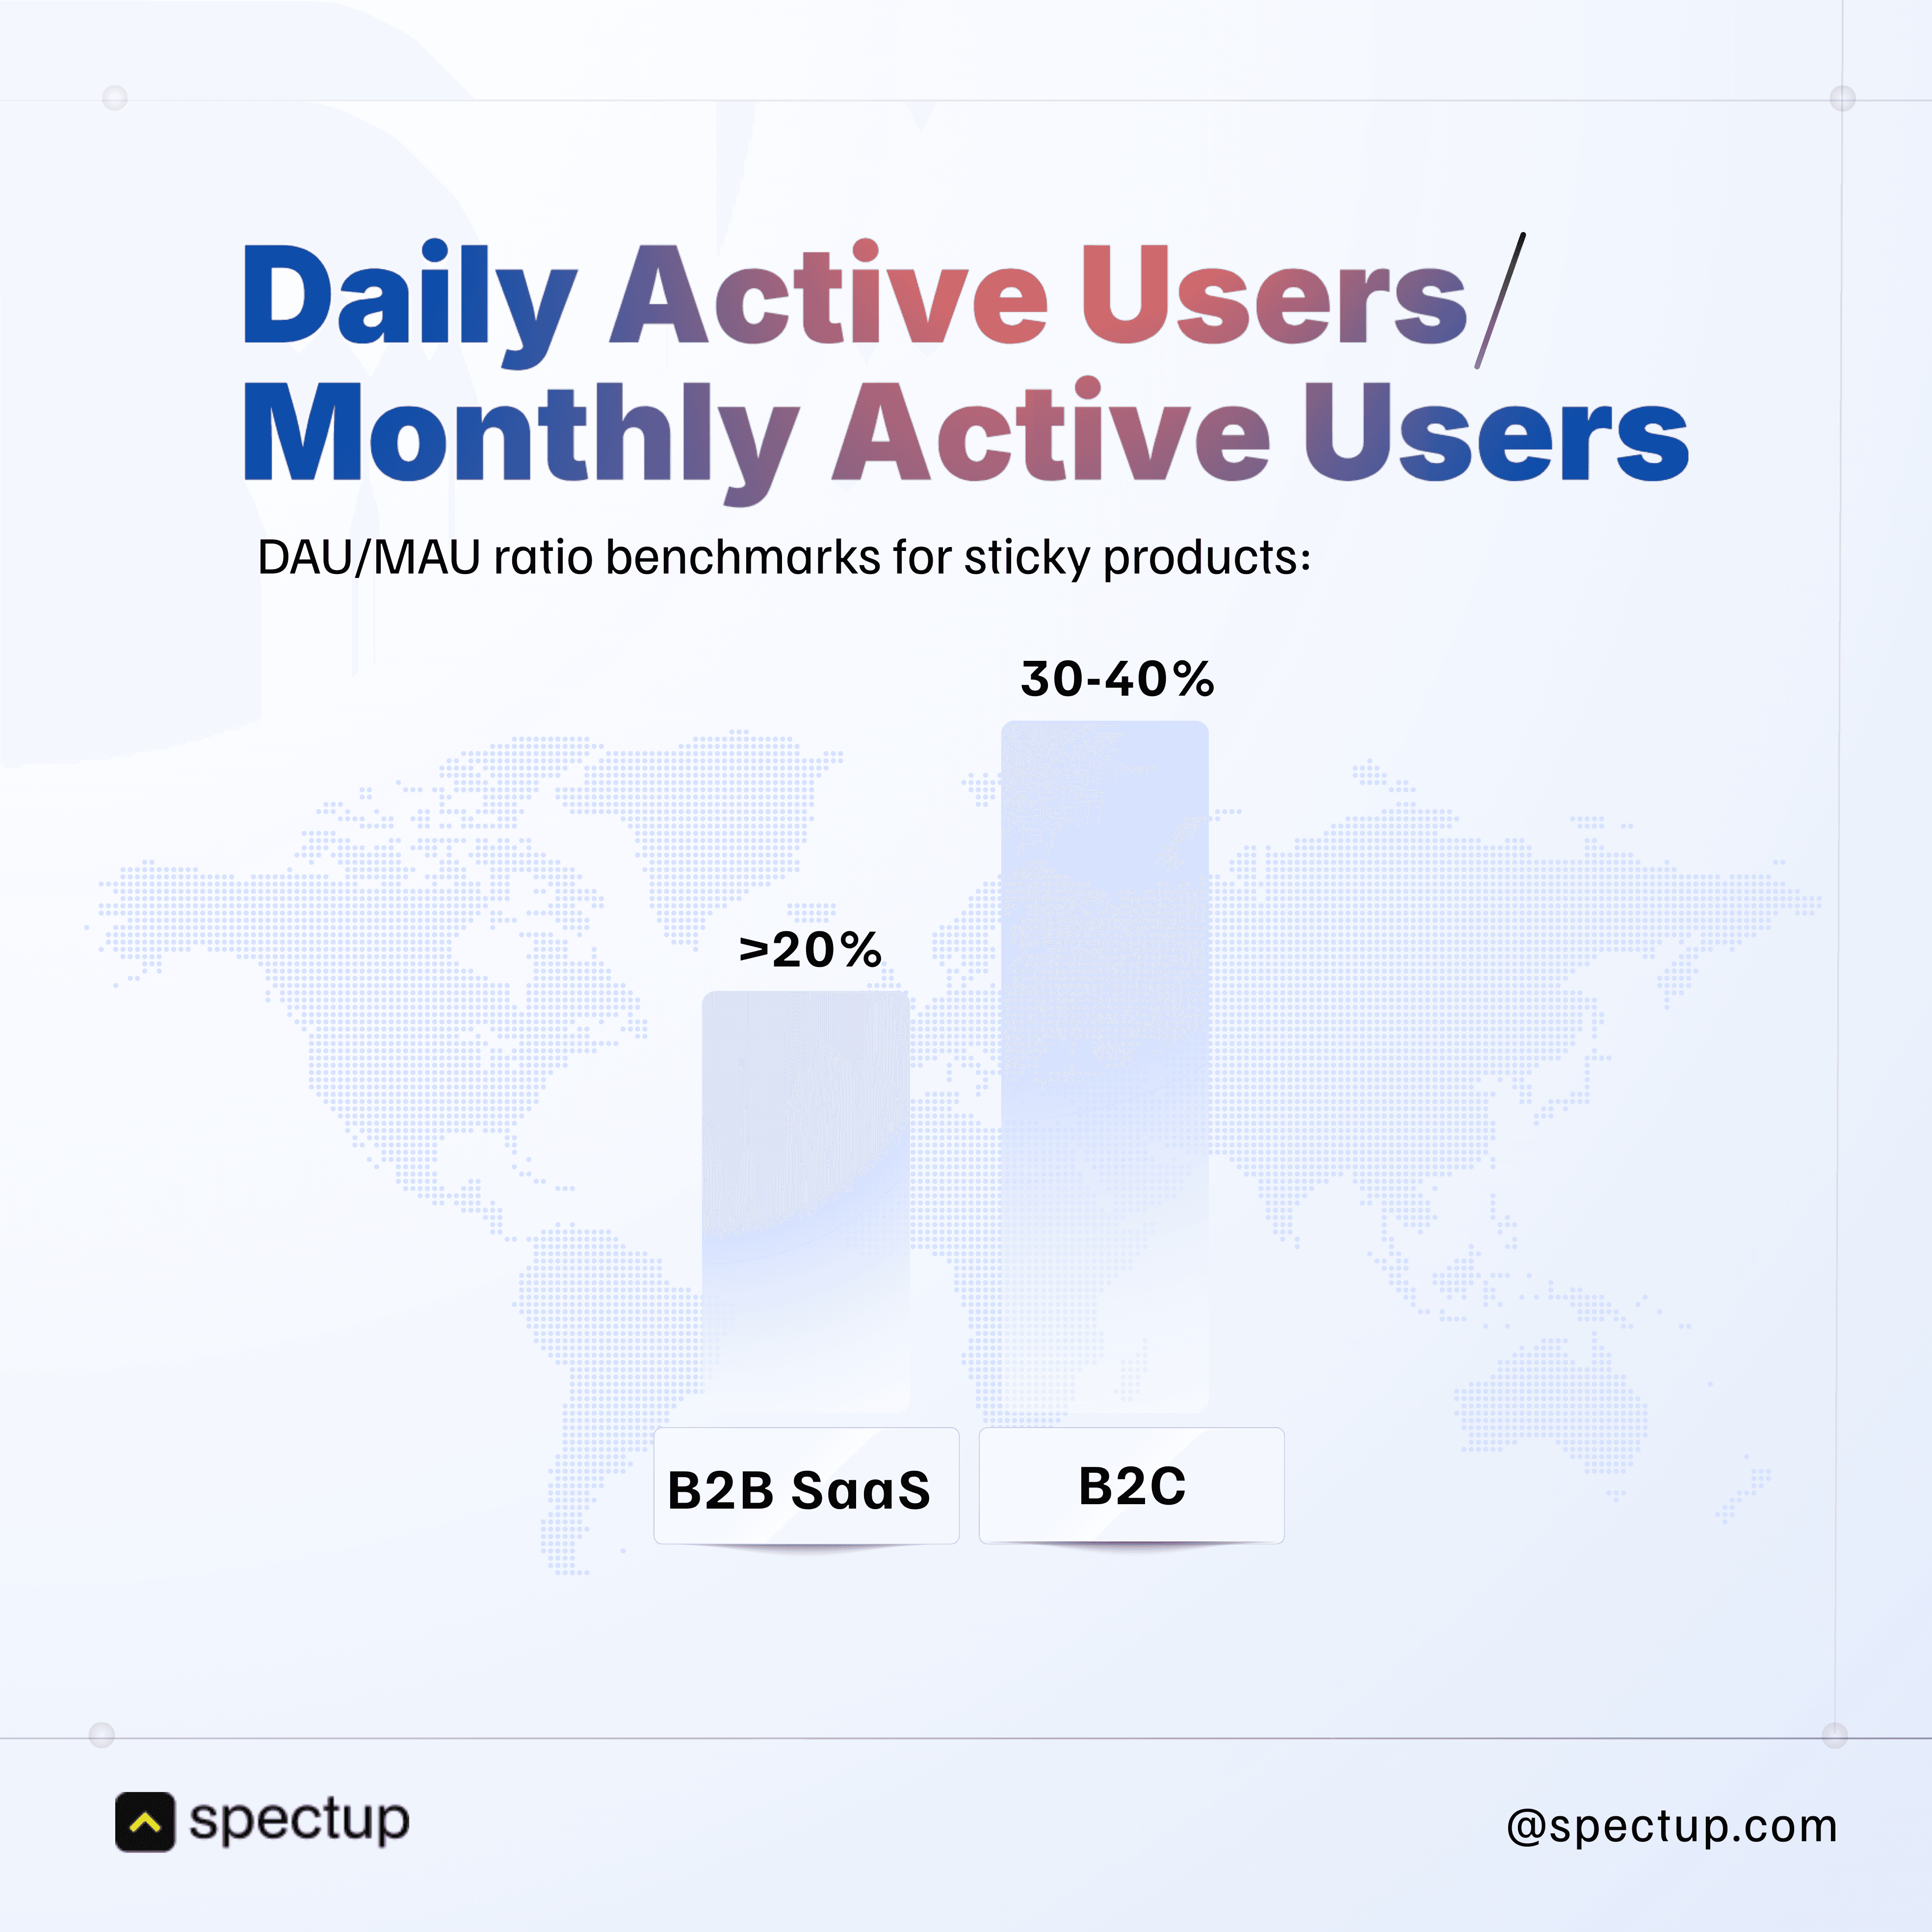
Active Users (DAU/MAU):
Daily Active Users and Monthly Active Users show how many people are regularly using your product. One-time sign-ups mean nothing. Consistent usage? That's a signal investors pay attention to.
Engagement Rate:
This tracks how deeply users interact, session length, login frequency, actions taken inside your app.
High engagement usually signals strong product-market fit.
Low engagement means you've got a retention problem waiting to explode.

Market Fit and Product Adoption: The Metrics That Separate Winners from Wishful Thinking
You might wonder why investors obsess over market fit and product adoption when they can already see your revenue numbers.
Simple: these metrics reveal whether your product actually resonates with your target audience, or if you just got lucky.
Revenue can lie. Engagement metrics tell the truth.
Product-Market Fit (PMF): The Holy Grail
Product-Market Fit means your product solves a real problem for enough people who are willing to pay for it, and keep paying for it. Without PMF, even a flashy sales spike is just a one-time fluke that'll evaporate the second you stop spending on acquisition.
Investors look for proof that customers love your product so much they stick around and tell their friends. That's the difference between a business and a marketing budget with a logo.
PMF Indicators Investors Actually Trust:
D30 retention rates around 60% or higher = iconic, hard-to-fake signal of product-market fit
Daily active usage consistency of 60-70% (users showing up 5+ days a week) = genuine market fit that's nearly impossible to game
Product Adoption Rate: Are People Actually Using This Thing?
Product adoption rate measures how quickly new users start actively using your product after signing up. High adoption signals strong initial interest and usability, a green flag that your product isn't confusing garbage.
Benchmarks That Matter (According to Ergomania Research):
Activation rates: 40-60% is industry standard
Time to value (TTV): Aim for under 5 minutes for new users
Feature adoption: 60-80% adoption for your key features
Product stickiness (DAU/MAU ratio): >20% for B2B SaaS, 30-40% for B2C
Now, you might be looking for a way to Boost these Investor Metrics:
Run tight customer feedback loops:
Regularly ask users:
What works
What sucks
What they want next.
Then actually listen.
Use data analytics like you mean it:
Track user behavior to spot friction points and features that genuinely delight. Stop guessing.
Iterate fast:
Use feedback and data to improve your product in rapid cycles.
Slow iteration = dead startup.
These steps help you align your product with real market needs, turning early adopters into loyal customers—exactly what investors demand for long-term success.
To capitalize on these insights, continuously monitor and optimize your PMF and adoption metrics. Proactive leverage of this data makes you infinitely more attractive to investors hunting for sustainable growth.
And most founders learn the hard way: Impressive revenue might get you in the room with investors, but it won't get the deal done.
We have seen that the startups that actually close their rounds know their numbers cold.
Not just revenue, all of them.
So, it's on you now to stop obsessing over revenue as your singular metric of success. Instead moving forward, no matter how drab or dull these sound, start treating these deeper investor metrics as the real scoreboard. Because that's exactly how investors are evaluating you.
Master them, optimize them, and use them to build a narrative that proves you're not just another startup burning cash and hoping for the best.
You're building something sustainable, scalable, and worth betting on. And if you trip somewhere, spectup is always here to make sure you are right on track and as sharp as any Funding Round can.
Niclas Schlopsna
Partner
Ex-banker, drove scale at N26, launched new ventures at Deloitte, and built from scratch across three startup ecosystems.


